When you’re planning your transition from Universal Analytics to Google Analytics 4, it’s helpful to understand what differences you’re going to come across. In this video and post, Dana walks through 8 key differences between UA and GA4.
This resource is a part of our video series on How to Set Up GA4 Right Now:
Video transcript
If you’re running both Universal Analytics (UA) and Google Analytics 4 (GA4) on your website and you go into both products to see how your site is performing, you’re going to see some differences. This often leads people to think that one product is broken. And maybe they’re both broken! In reality, both products are measuring stuff the best they can, but they use the same words to mean slightly different things.
Confusing? Yes, absolutely, but I’m here to bring you the clarity you need.
If you Google the differences between UA and GA4, you’re going to get this very boring list of metrics courtesy of Google. A lot of the language in that article is pretty technical as well, especially if you aren’t familiar with the ins and outs of GA4 already. In fact, a lot of the information about UA in that post may not make sense either unless you have a lot of experience using that tool as well.
Most people just want to set up their analytics and then look at some basic information about how their website is performing. That is not the audience for this Google Help article.
This video and post on the other hand, will help you actually understand the differences between UA and GA4 from a normal human being perspective.
UA to GA4 Terminology Clarification: Dimensions and Metrics
First, let’s clarify some terminology used in this video.
Dimensions and metrics: if you aren’t familiar with those terms in an analytics context,
- A Dimension is a grouping of data. For example, a specific page or a channel that brought people to your website, such as Facebook.
- A Metric is a number, for example, the number of times that page was viewed, or the number of people who came to your site via Facebook.
Also, if you would like to visually see the differences between your UA and GA4 data, Krista Seiden has published an excellent Looker Studio dashboard that you can use to compare your two properties.
Users Metric
Let’s start with the Users metric. This is the number of people who came to your website, right? Unfortunately, UA and GA4 measure this differently (because *sigh* of course they do), which is why the numbers probably aren’t going to match.
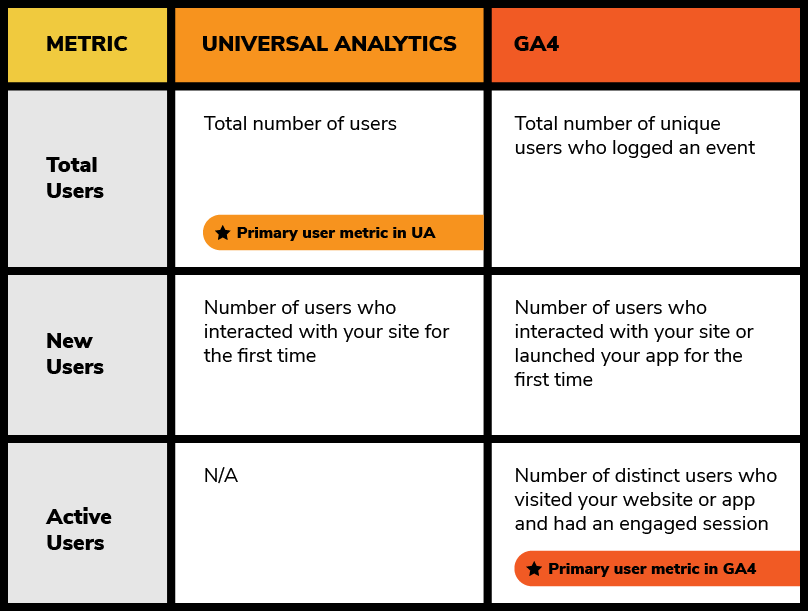
A user as far as Google Analytics is concerned, generally is a device. So if I’m on my phone and I’m on my laptop, I’m two users.
There are some ways to combine those two devices and know that I’m the same person on both, but the simplest answer is that every device is a user. UA counted everyone as a user, which meant you ended up with weird situations like when you have 50 tabs open and reactivated your browser after your laptop went to sleep. When that happens, each of those little browser tabs will send a little “you still there?” message to the website. Then UA would dutifully record that check-in as a user with a zero-second page view, even if you didn’t even look at the tab.
In GA4, they’ve tried to get rid of this issue. When you see users in GA4, what they’re counting in that case are active users. Those are people who are considered to be engaged, which is also a new metric in GA4.
Active users are:
- people visiting your website for the first time,
- or spending at least 10 seconds with your website as their active tab,
- or going to a second page or converting.
If 10 seconds seems a little short, you can adjust that in the settings. I prefer the GA4 metric because it focuses on actual people using your website as opposed to all those potential tab hoarders that get factored in with UA. We’ve seen differences of anywhere from 5 to 30% between UA and GA4 when it comes to user counts.
Sessions in GA4
Let’s move on to something closely related to users and talk about sessions. Sessions are pretty different in GA4 compared to UA because of how GA4 records things that happen on your website. UA considers a session to be a collection of stuff that a visitor does while visiting a website.
There were a few ways a session would end in UA:
- 30 minutes of inactivity – if a visitor is inactive for 30 minutes or whatever the session timeout is set as (most people never changed the default setting), so in your case it was probably 30 minutes),
- Time zone hits midnight – if a visitor is on the site the time changes to midnight for the time zone that has been set in UA, then this would end their current session and create a new one, or
- Different source: if a visitor came back to the website through a different source (Google ads, social, newsletter, etc).
Let’s dive deeper into a session in Universal Analytics ending due to a different source:
Say you visited a website via a Google Ad, and then you couldn’t find what you were looking for. So then you went back out to Google and you Googled the name of the company and what you were looking for. Then you clicked on a non-paid organic search result to get back to the website— that would end the previous paid session and start a new organic session.
In GA4, when you first arrive on the website, GA4 records an event called session start and creates a session ID for you. Then every piece of data sent off to GA4 includes that session ID.
How sessions in GA4 work:
- 30-minutes of inactivity – if a visitor is inactive for 30 minutes (or whatever you set it to) then the session times out (the same as it was in UA)
- Time zone hits midnight and nothing happens to the session – in GA4 if a visitor is on a site at midnight, the sessions aren’t cut off
- Different sources do not end sessions – if someone comes back to a website via a different marketing channel their current session is still active.
Why are session counts different from UA to GA4?
- Filters – There could be filters in your UA (i.e. you’re excluding internal traffic)
- Geography – You could have a geography issue if you have a global customer base and you have a lot of people hitting that midnight limit on a regular basis in UA, but now because this is not an issue in GA4 and sessions don’t end at midnight your session count is different.
- Estimation – What the difference probably is, is that GA4 estimates session counts. They don’t actually count the number of unique session IDs that are generated for that particular GA4 property. GA4 does an estimate instead of an actual count because they probably don’t want to spend a lot of processing time counting the number of sessions. Basically, Google wants to save money.
You could always export the session data from GA4 and do your own counts, but in most cases just know that it will vary. When comparing UA to GA4, you might see differences in the 10% to 30% range when it comes to sessions.
Acquisition Data
Before we move on from users and sessions, we need to discuss acquisition data, which is the “how do people get to my website” information. In UA, you’d see that information under acquisition. You’d see information for users, new users, and sessions all in a single report. In GA4, acquisition is entirely split up between users and sessions. So what should you use in your reporting? It depends on what you’re measuring!

If you have people logging into your website and you’re sending user IDs off to GA4, you want to look at the user reports. Otherwise, the session reports are going to be what you want most of the time. Looking at users is just not a reliable way to count people visiting your website unless you can track them using your own logins. So both of these two options, user acquisition and traffic acquisition, have the same limits of measurement that we just covered. Nothing is 100% accurate, ever.
You also need to remember that a ton of people use ad blockers! Some people use browsers that clear their cookies regularly and some people use other identity obscuring products that prevent you from tracking acquisition clearly. You are definitely never seeing the full picture here, no matter what analytics tool you use.
Looking to improve your analytics skills?
New Channel Dimensions in GA4
There are some new channel dimensions in GA4 that are definitely worth a mention. In fact, you might start seeing some right away in your reports, depending on what kind of traffic you already have coming to your website. We have a resource post with a list of the new dimensions and how to use them.
Social media is now split into organic social versus paid social, and there’s new paid shopping and paid video channels as well. You might have seen a channel called “other” in UA, that is now called “unassigned” in GA4. Unassigned means traffic that has a source and medium combination that doesn’t match GA4’s default channel definitions. You can add two custom channels for traffic sources that don’t match up nicely with GA4s channel groupings as well. Overall, GA4 is a big improvement from UA.
Page Views in UA = Views in GA4
The next metric that’s commonly used is page views, and this metric is usually pretty accurate. What typically makes a difference is if you had filters set up in your UA that might have been excluding people based on your office locations, maybe a development website, that sort of thing.
In GA4, this metric is called Views. UA also had a metric called unique page views, which was just the total number of pages viewed, without duplicates. So if someone went to your homepage twice during a session, the page view count will be one. That unique page views metric does not exist in GA4. So if you were using it for reporting. it’s time to switch.
Conversions (formerly Goals in UA)
March 2024 Update: Conversions are now called Key Events in GA4.
Conversions, of course, are really important. That’s how you know if your marketing work is paying off, right? There are some pretty big differences in how conversions work between UA and GA4. In UA, conversions were called goals, and you define them based on a few options.
UA Goal options
- Event
- Page view
- Number of page views
- Time on Site
If you had those types of conversions, they were probably bad and you should not have them any longer. We have a pretty firm rule at Kick Point when it comes to conversions! If an action is directly contributing to your organizational goals, then it can count as a conversion. If there is no direct correlation to a business goal, then it’s just an interesting observation.
If you had ads on your site and you made money via people viewing pages, then maybe the number of pages that people viewed does actually matter. However, most of the time that is not the case!
In GA4, conversions are based entirely on events (because GA4 is based entirely on events), but there are ways to recreate the things that we used to track before in UA as events in GA4.
The most important thing to know about conversions in GA4 is that there is an option to change how the conversion is counted, and that’s important for when you’re comparing conversions between UA and GA4. In UA, a specific conversion, (called a goal in UA) would only be counted once per session. So if you were on a website and filled out a form three times, you would only have recorded one conversion.
This was pretty common for things like B2B companies putting resource downloads behind a form, you might download more than one thing in your session, but if that company was grouping all downloads under a single goal (which was typical), they’d only see one conversion for that session.
In GA4, you now have the choice in how you want your conversions to be counted. They can be counted every time the ‘thing’ happens. That’s called once per event, or you can change it to count the UA way, which is called once per session.
To sum up, in GA4 you can choose how to count conversions:
- Once per event (new in GA4)
- Once per session (UA method)
Make sure to check all of your conversions, especially if they were imported from UA, because they might be set to once per session and that method might not make sense for your reporting needs anymore.
What About eCommerce?
Let’s talk about purchases briefly, because they are closely related to goals. These should more or less match up between UA and GA4, because that’s one metric that GA4 is not really messing around with. If you have an e-commerce website and you’re seeing big discrepancies between the revenue recorded in UA and GA4, you probably have a configuration issue going on that you need to take a look at.
Bounce Rate
Now last, and frankly certainly least, let’s talk about bounce rate. I hate bounce rate.
It’s the most useless metric because it was not actually measuring what anyone thought it was measuring. In UA, bounce rate was measuring the amount of sessions where only one page was visited and no measured interactions occurred. This was flawed! For example, let’s say you have a newsletter form on your blog post. Someone could’ve spent 20 minutes reading a blog post and then signed up for your newsletter, but if you didn’t take them to another page to say thank you when they signed up, that person now counts as a bounce. That’s clearly incorrect, and that’s why bounce rate sucks.

(Sidenote: you need this dumpster fire sticker.)
Engaged Sessions in GA4
In GA4, there is a new metric called engaged sessions, and we all thought bounce rate was dead. Great. Let’s look at engaged sessions, but turns out, bounce rate isn’t dead GA4 decided to introduce a metric called bounce rate, but it’s not measuring the same thing that UA measured.
In GA4, bounce rate is the percentage of sessions that weren’t engaged sessions.
So what’s an engaged session? Earlier, I talked about active users, which are visitors who are going to your website for the first time, spending at least 10 seconds with your website as their active tab, going to a second page, or converting. If 10 seconds is too short for your situation, you can make that longer in your GA4 admin settings. Keep in mind that that isn’t at all what bounce rate was measuring in UA.
I do like engaged sessions, I think it’s a really useful metric, but it isn’t going to match your bounce rate in UA at all. If it does, it’s a total fluke and not on purpose. So while I hope you weren’t reporting on bounce rate to your boss or client for all these years, maybe you were! If so, you’re going to have to explain why that metric is going away and why measuring engagement rate is more effective.
That sums up the major differences in how certain things are measured between UA and GA4. Now you should be able to explain to your stakeholders why the data looks different, and if it’s too different, you now know where to start troubleshooting!
Do you have more questions? Check out our other videos to get more answers and let us know what topics you want us to cover in future videos. Thanks so much for reading!
Elevate your GA4 skills with our help!

Dana enjoys solving problems that haven’t been solved before. With her 20+ years experience in digital marketing and teaching, she has a knack for distilling complex topics into engaging and easy to understand instruction. She brings this skill to prominent digital marketing conferences around the world (ie. SMX, MozCon, WordCamp, or American Bar Association), LinkedIn Learning courses, teaching at the University of Alberta, and hosting the technology column on CBC Edmonton AM.
Learn more about Dana