If you’re still getting adjusted to the Google Analytics 4 interface, it can be overwhelming trying to find your favourite and familiar reports from Universal Analytics. In this video, Dana walks you through report edits, custom reports, and shows you how to find your favourite UA reports.
This resource is a part of our video series on How to Set Up GA4 Right Now:
Video transcript
The Google Analytics 4 (GA4) user interface can be a bit of a shock when you’re coming from Universal Analytics (UA). There’s less data shown and less reports, which can make people think that there’s less information available, but the information you need is there— you just need to do some digging to find it.
In this guide, we’ll cover some of the most common reports you were (probably) using in UA, and show you how to find that same information in GA4.
Of course, there are lots of third party reporting tools out there, but if you want to use GA4 and not learn a new tool, this guide is for you. Before we get into individual reports, I want to cover a couple of new features in GA4 that are really useful.
Report editing in UA vs. GA4
To edit a report in UA, you could click on the Edit (pencil) icon which would take you to Custom Reports, and then you could create a custom version of the report you just saw in front of you.
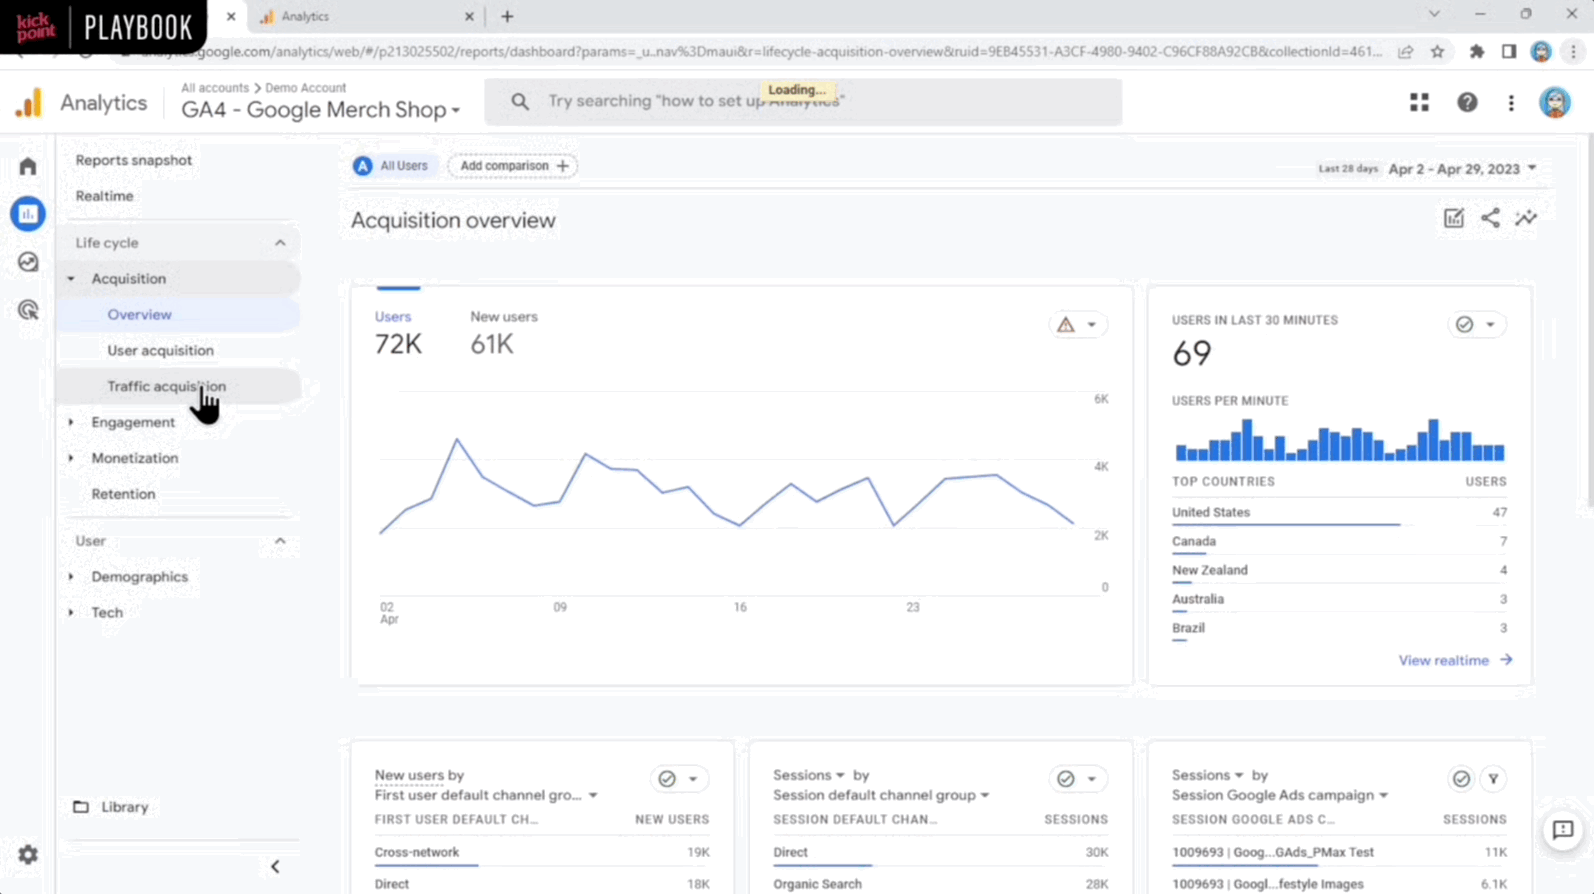
In GA4, it’s a little bit different. The Edit icon actually lets you change the report that is in front of you. For example, in this Acquisition Overview Report I can add or remove cards.
📇 Cards appear in overview reports and summarize information about one or more dimensions and metrics from a detail report (which can have up to two visualizations and a table), you can have a maximum of 16 cards in your report.
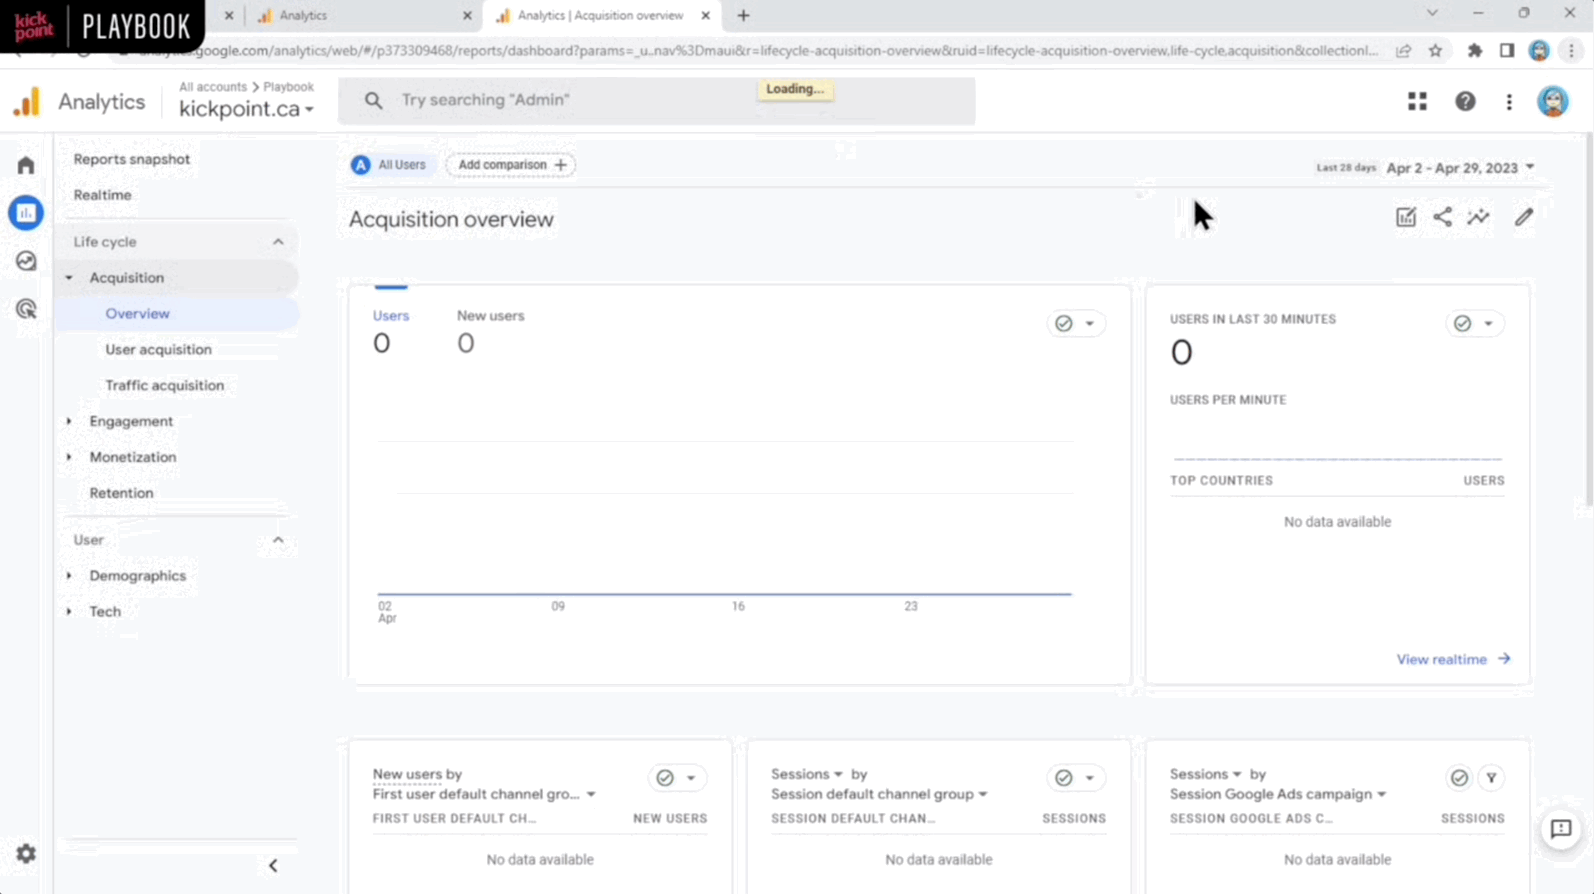
Switching to a Detail Report like Acquisition Overview, here the Pencil icon/Edit feature lets us change the Dimensions of the metrics that are shown on the page. For example, if the report we’re looking at isn’t for an e-commerce site we can remove revenue by:
- Login in to your Analytics account
- Click on Reports
- Select the Acquisition dropdown
- Click on Traffic overview report
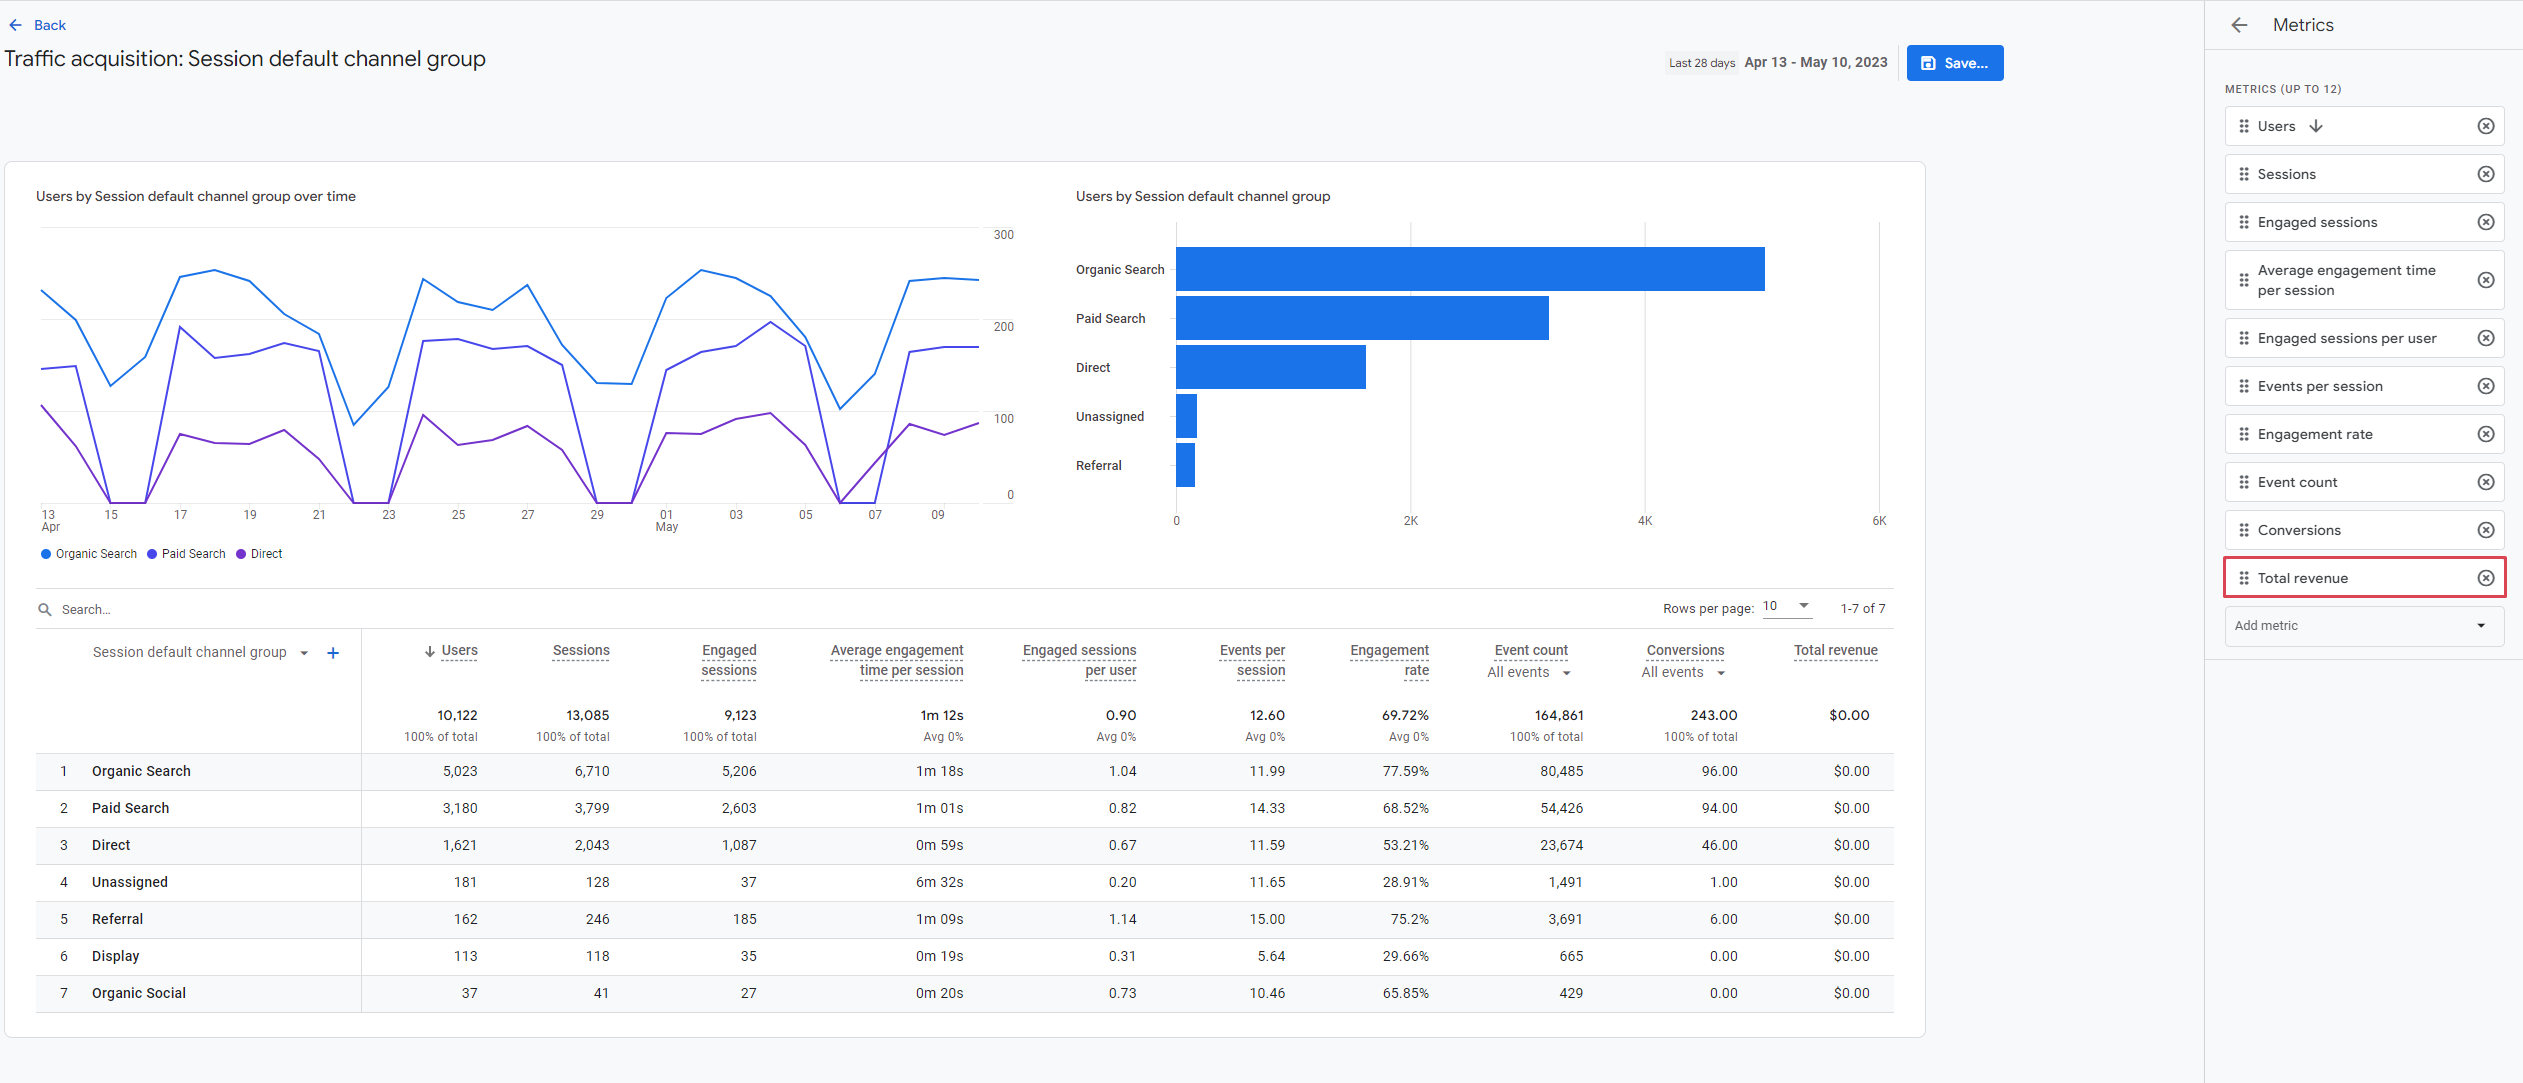
- On the top right of the screen click the Pencil icon to Customize report
- Click the Metrics dropdown
- Scroll down to the Total revenue
- Click on the X to remove it
- Click Apply
Revenue will no longer be listed on the report. In this way, you can customize the metrics that make sense for you and change it for everybody.
There are two options available to save edits:
- Save changes to the current report which changes the default report settings to reflect the updates/edits you made. This changes the report for everyone with access to the analytic account.
- Save as a new report which will then be added to your Library and can be accessed from here on out.
Custom reports in GA4
If you used custom reports in UA, you can create custom reports in GA4 as well. That’s done under the Library section on the sidebar (bottom left) of the Reports snapshot view. In the Library, you can create different collections of reports that you can make accessible in GA4.
Don’t see the Library option? You need editor or admin level permissions in GA4 to access this feature.
What’s nice about collections is you can group things together, and you can even set a custom report, or any report, to be the first thing you see when you open up GA4.
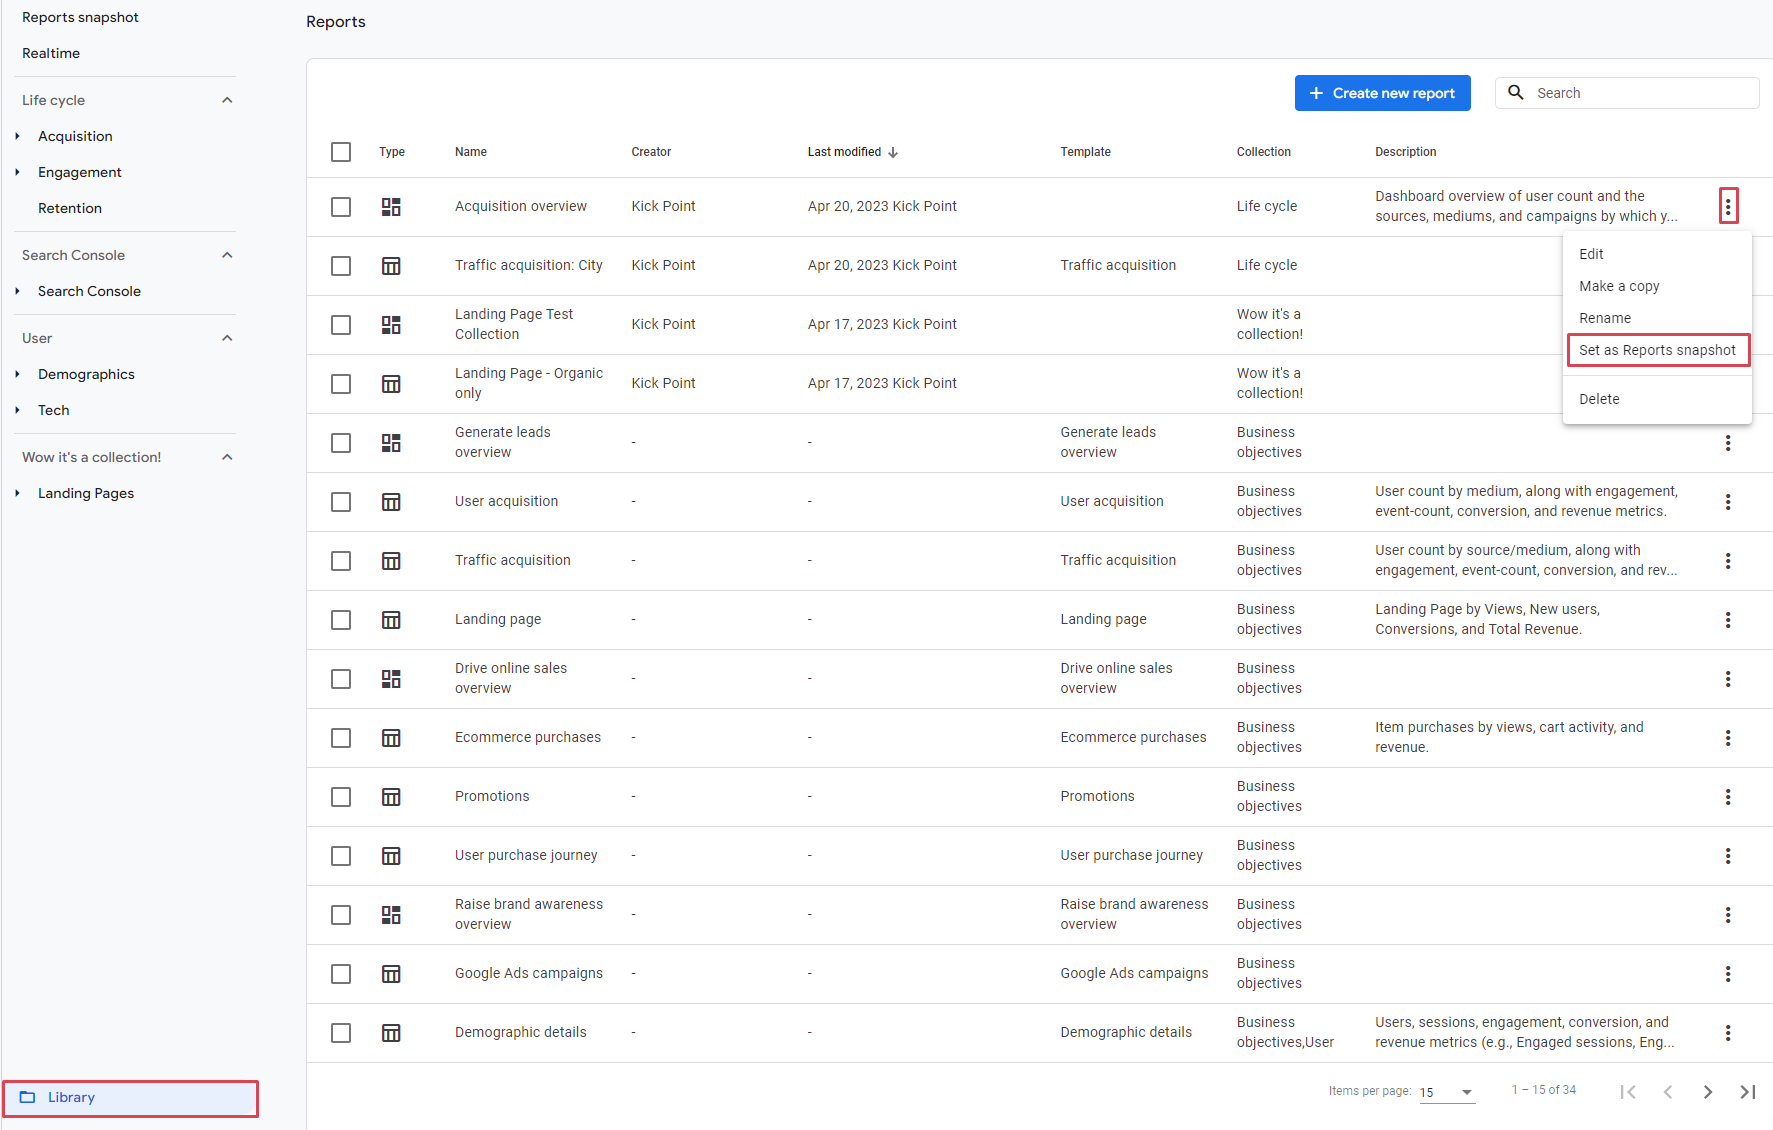
Create a collection in GA4 by following these steps:
- Click the link to the Library (on the bottom left) in your Reports snapshot view
- Click the three little dots (Collection action menu) next to any of the overview type reports
- Select Set as Report snapshot
Useful reporting features
One last thing before we get into specific reports: when you’re looking at a report, there are three really useful features.
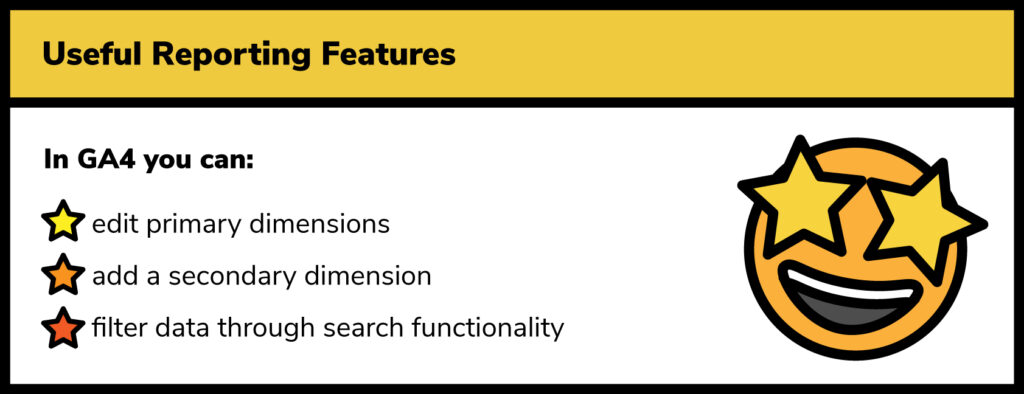
#1. Primary dimensions are editable
First, if we scroll down a bit, you’ll see that the primary dimension is a dropdown, so you can change how the report is presented— that’s why it looks like there are less reports in GA4, because in UA there was a separate report for each dimension in this dropdown.
#2. You can add a secondary dimension
Second, next to the primary dimension you can click the + icon to open up a second dimension. For example, if we wanted to see session default by city, we could add that as a secondary dimension.
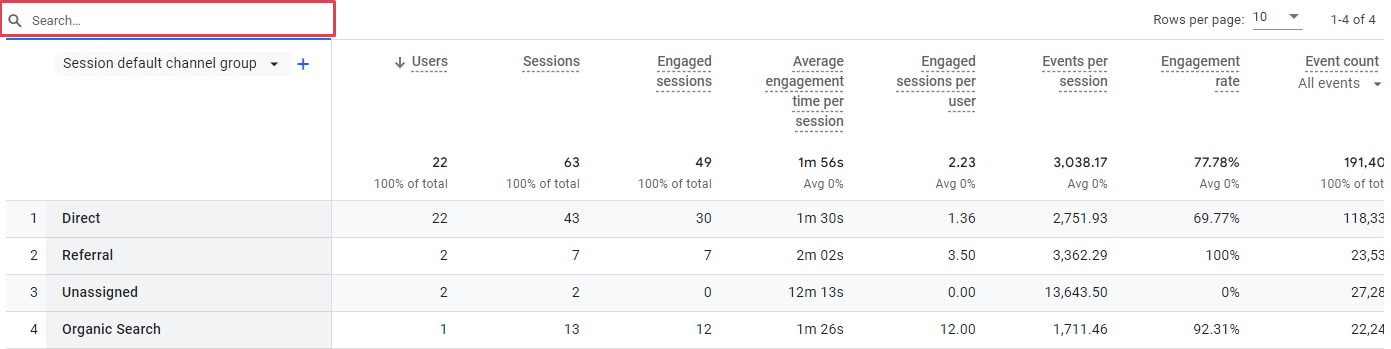
#3. Filter data through search functionality
Third, you can use the search field above the primary and secondary dimensions (which feels really hidden) to filter the data that you’re looking at.
Elevate your GA4 skills with our help!
Favourite UA reports in GA4
Channels Report
The first report we’re going to take a look at is the channels report, which is found under Acquisition > All Traffic Channels in UA.
This is a really common report that I and a lot of other people used quite often. Traffic is grouped here under these default channel groupings based on rules that are baked into UA, and the same is true for GA4, although there are some changes to channels and some new channels that we covered in our video on the Differences Between UA and GA4.
To find the Channels Report in GA4:
- Go to the Reports snapshot
- Under Acquisition, then you can click on either User acquisition or Traffic acquisition
- User Acquisition shows the first way that people got to your website (if you track user logins this report is relevant)
- Traffic acquisition is more focused on individual sessions.
💡 Remember that users only really matter as a metric if you have user logins. Otherwise, you can’t guarantee that you’re truly tracking users across multiple sessions.
Let’s open the Traffic Acquisition report:
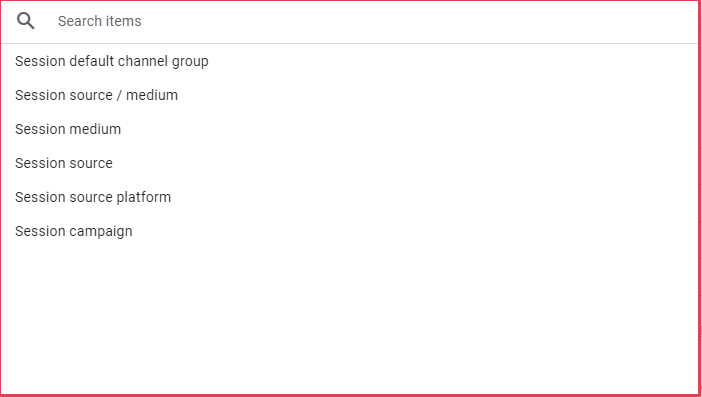
- By default, this information will be shown to you in the Session Default Channel Group, just like in UA.
- You can change that using clicking the dropdown (the arrow next to the primary dimension). So you could change the view to be by Source Medium instead.
Events Report
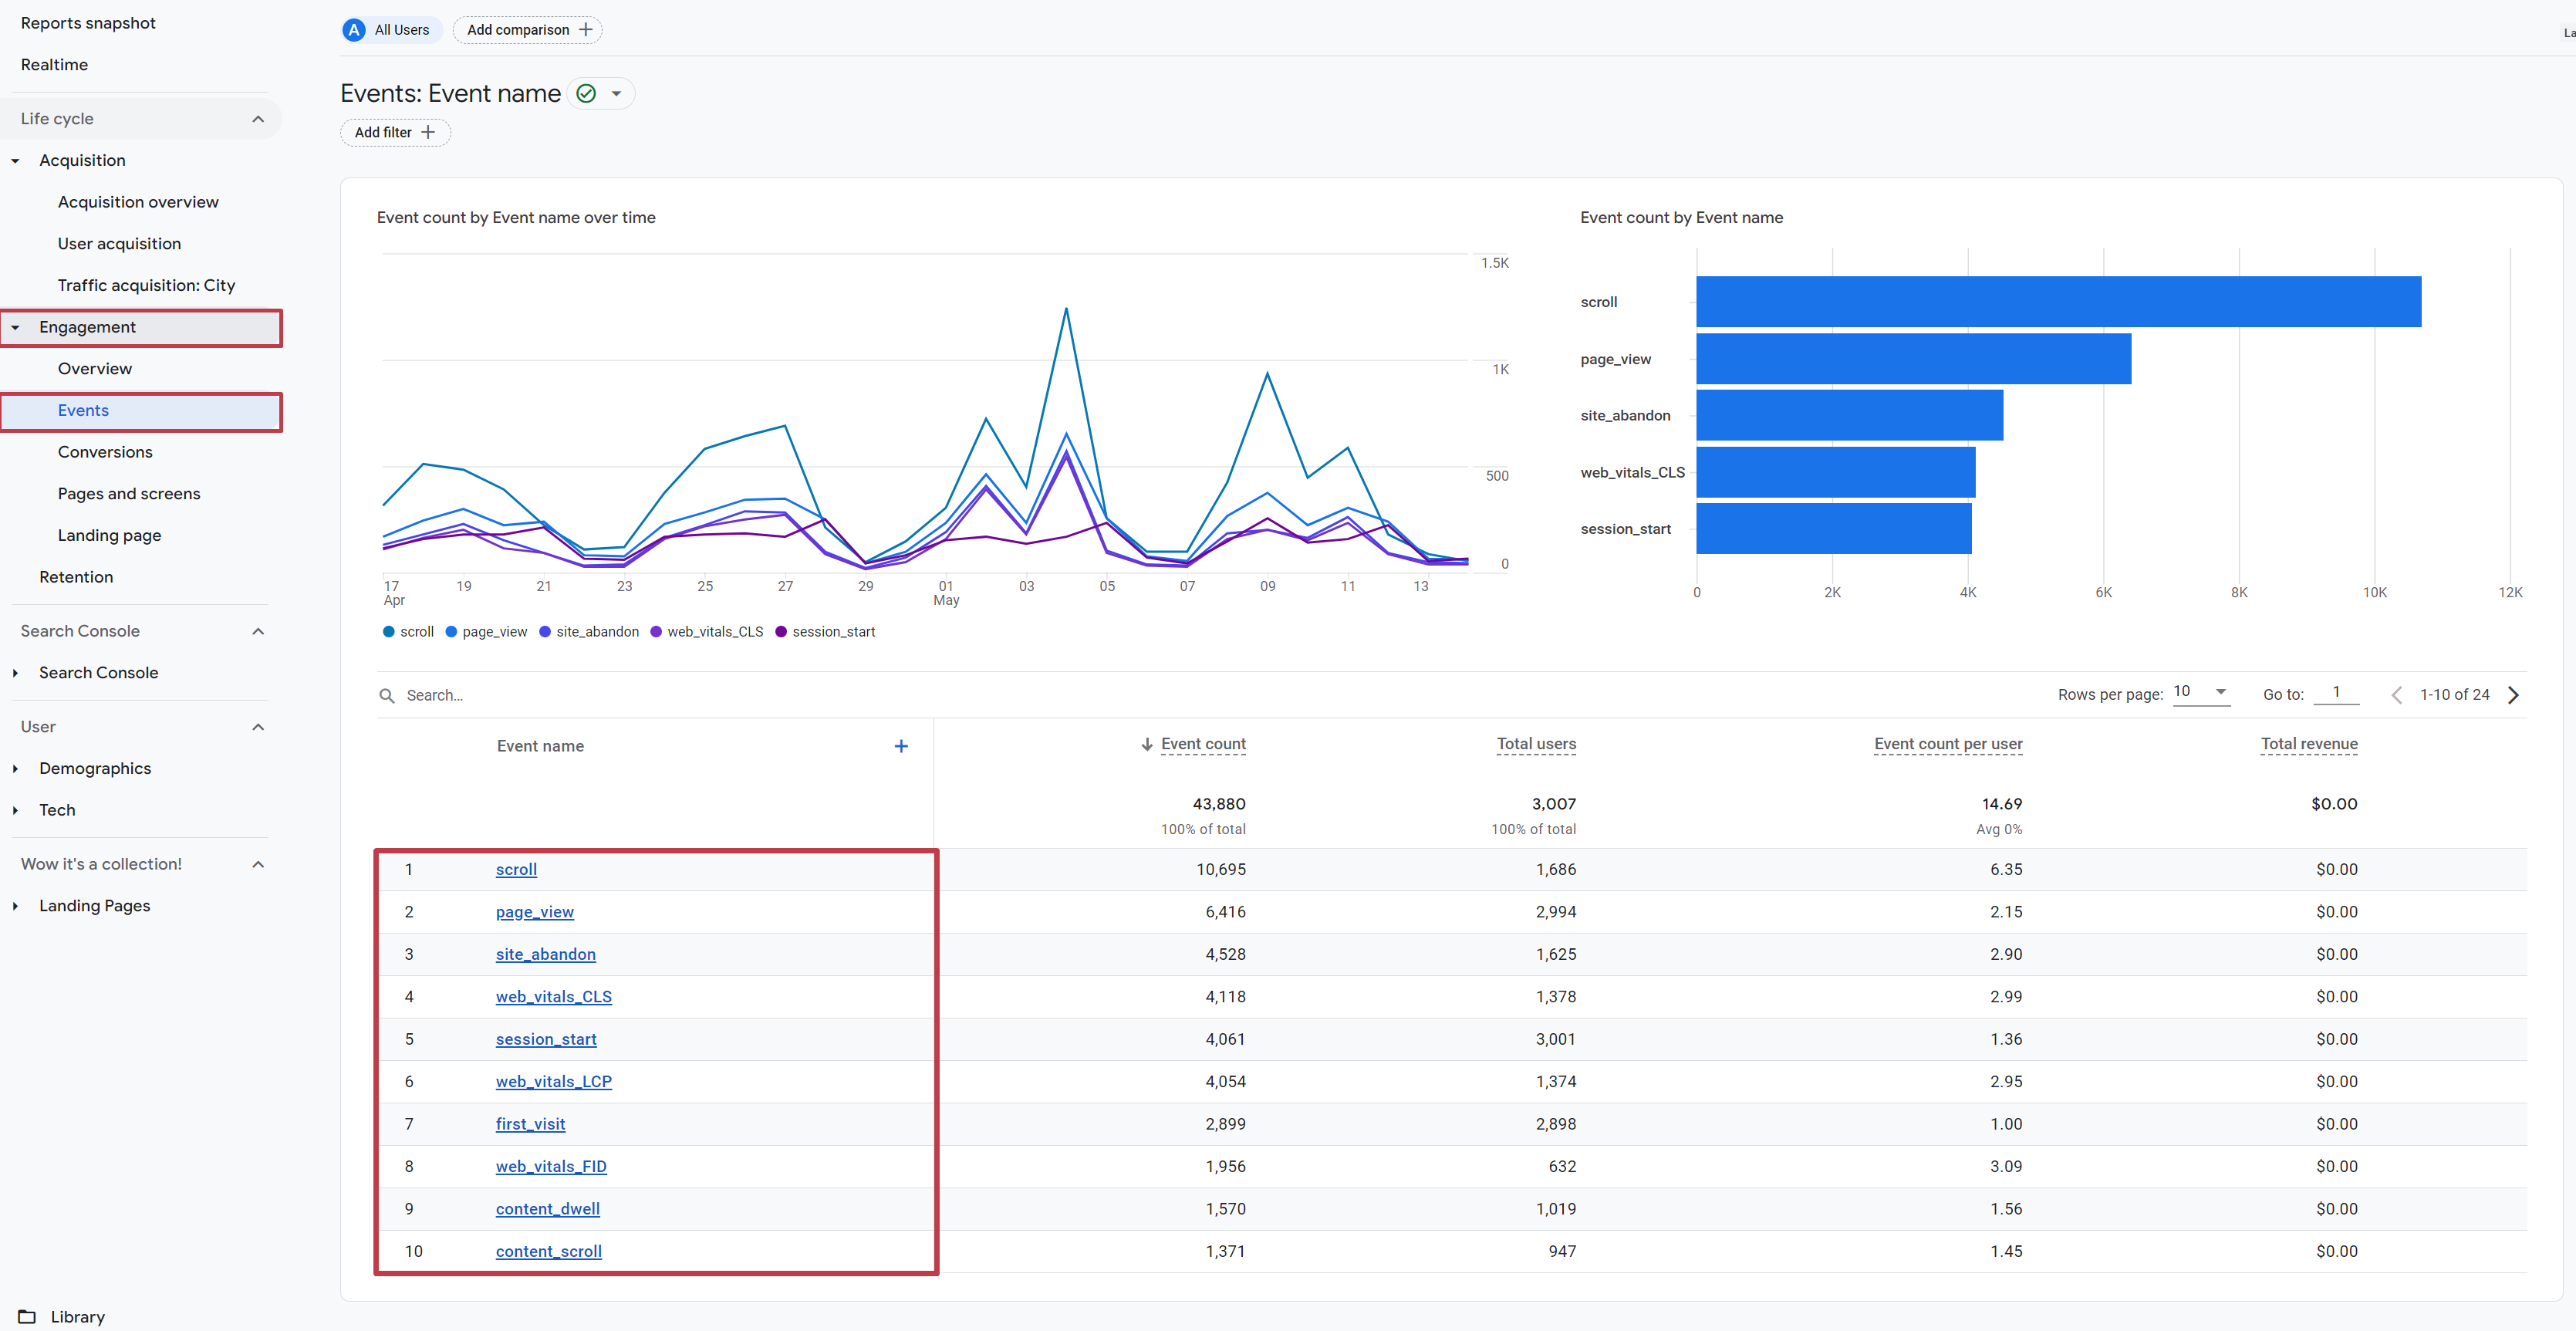
The Events Report in UA was under Behavior > Events > Top Events. We use this report quite a lot to make sure that events are recording as they should, and since everything is an event in GA4, it’s even more important.
In GA4 you can see this information under Engagement > Events. You can click on any one of the individual events to show more information. For example, you can click on the Page View, and then you can scroll down to see additional information.
Landing Pages
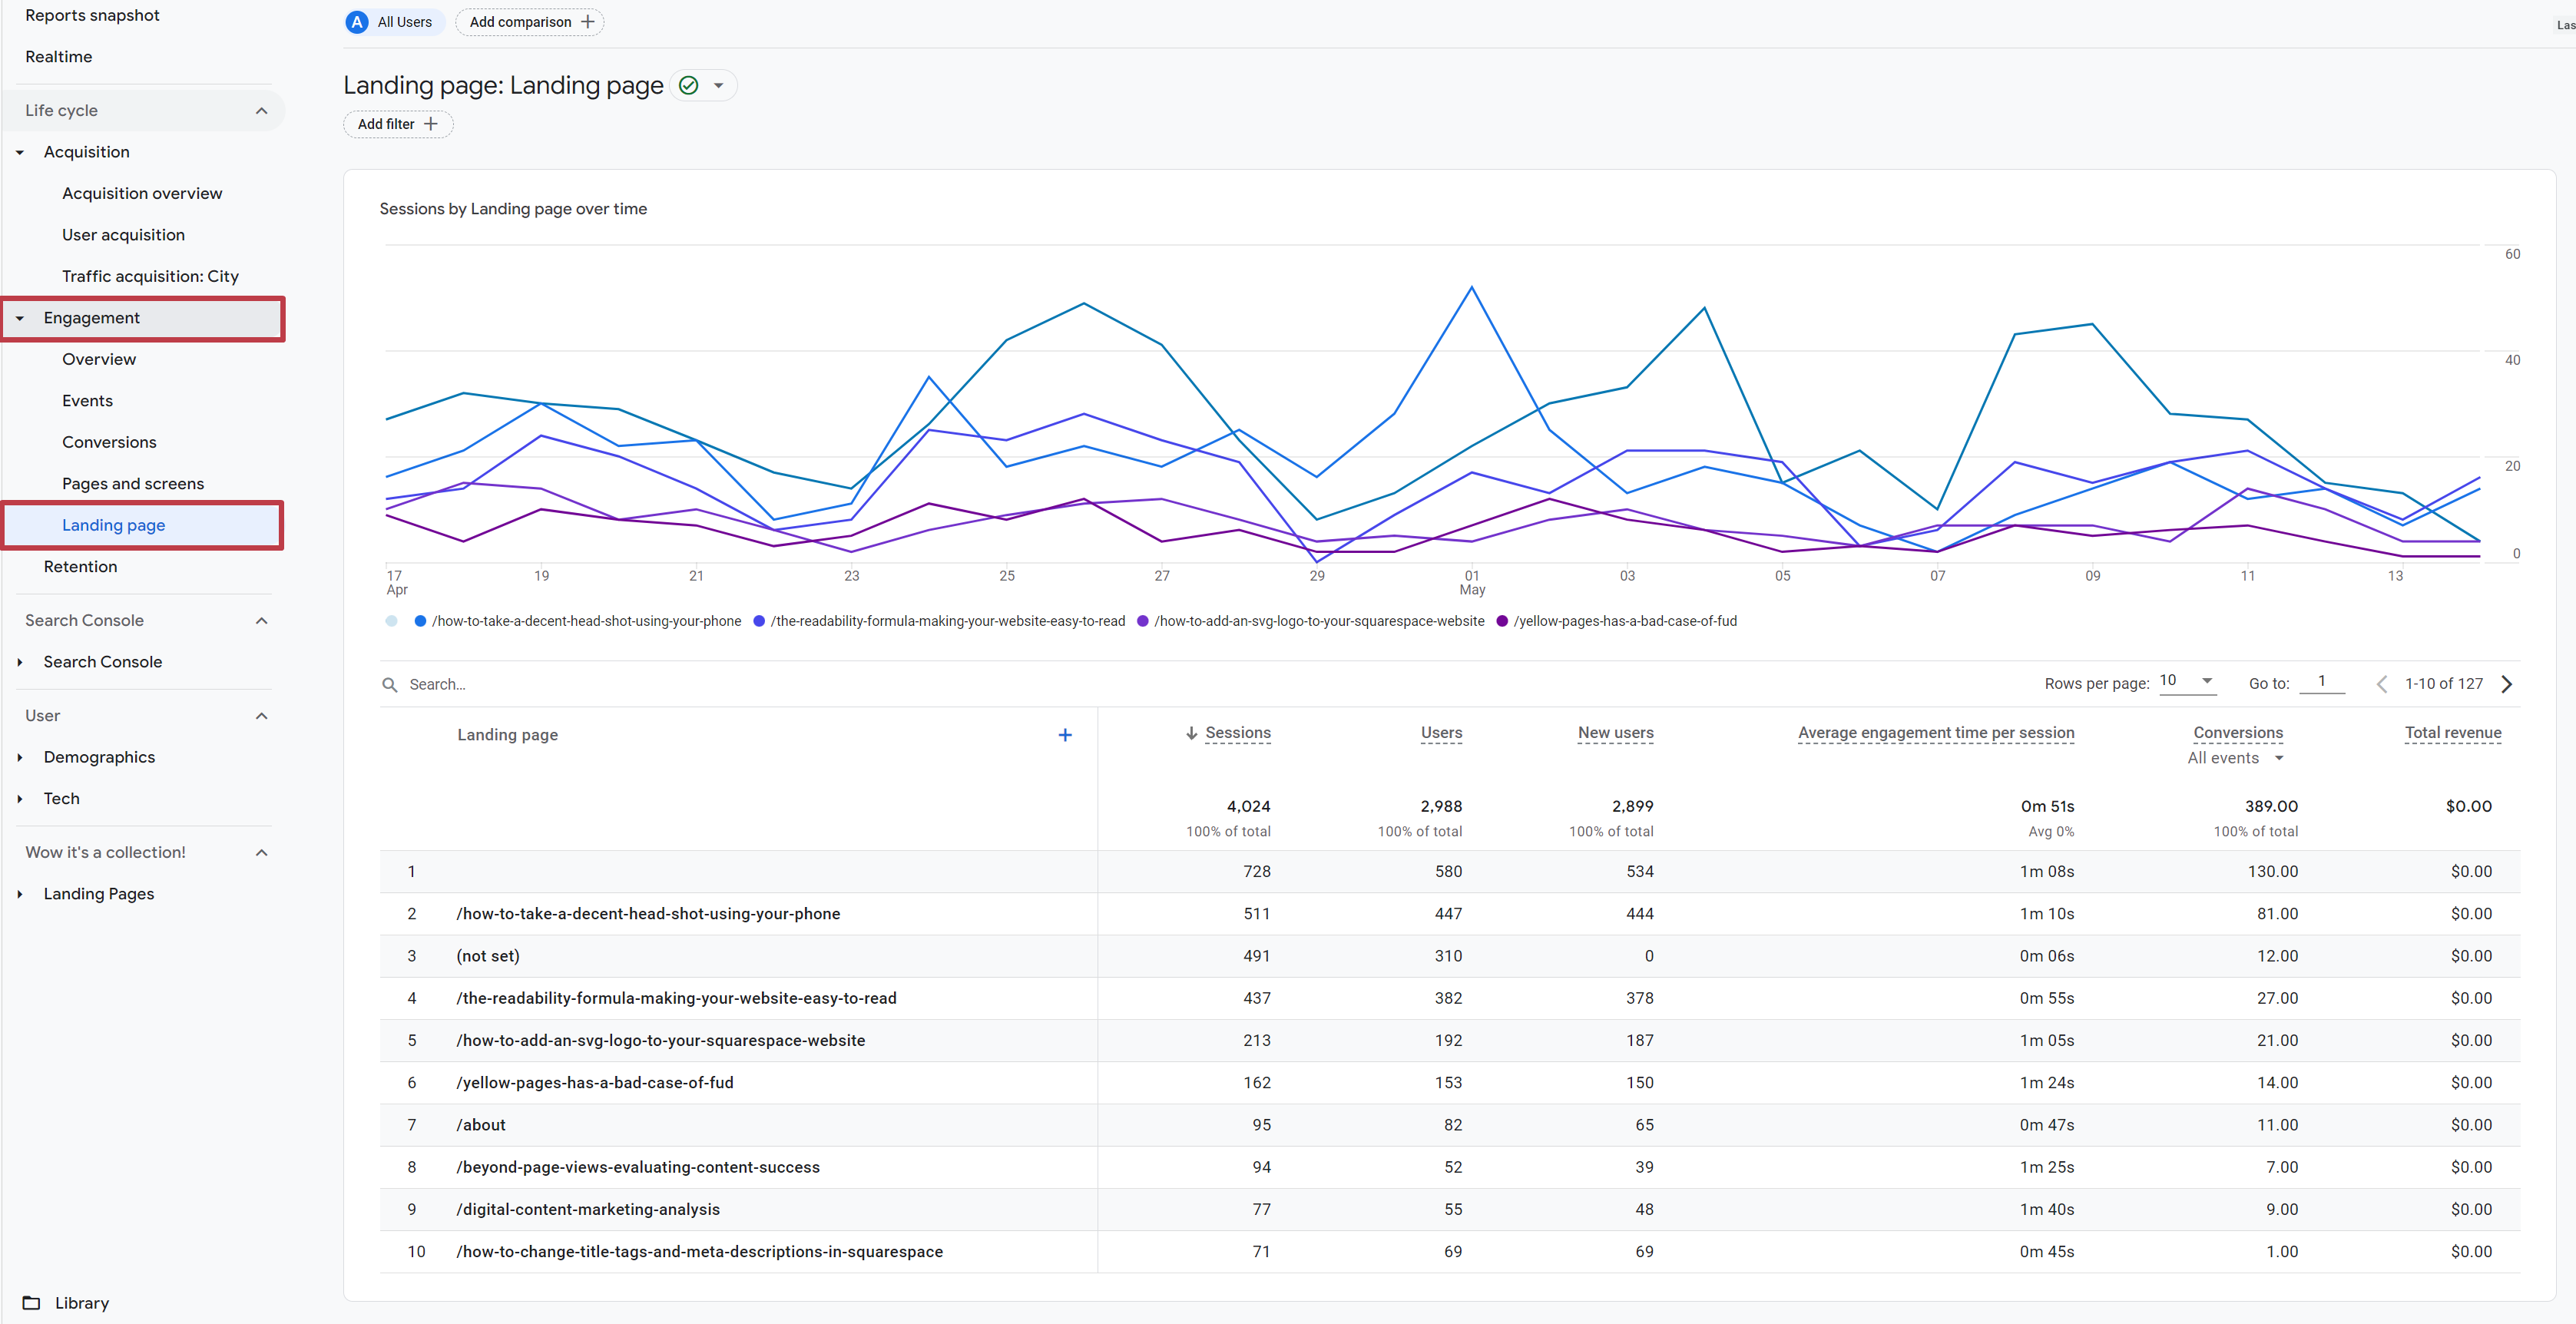
Another really useful report in UA was landing pages, and if you work in SEO, I’m sure you use that quite a lot to see which landing pages were getting the most organic traffic. In UA this report was found under Behavior > Site Content > Landing Pages.
The landing pages report in GA4 is found under Engagement > Landing Page.
Now, what if you want to filter the landing page report in GA4 to look at just Organic Traffic?
- Click on the Chart icon (top right) which brings up the Edit Comparisons functionality
- Then, click the + Add new comparison (this is like Segments in UA)
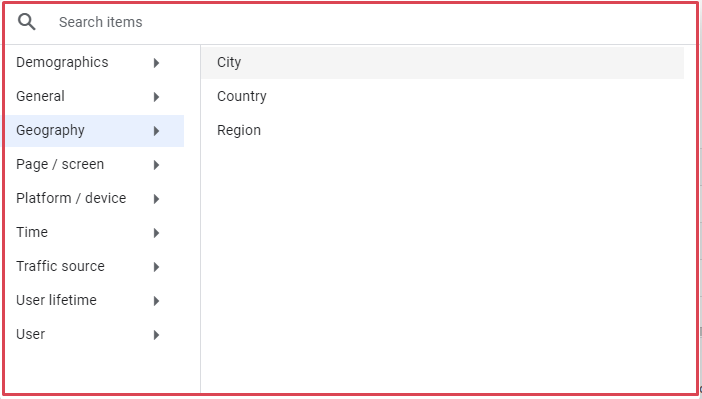
- To build your comparison you’ll click the Select dimension dropdown
- Start typing in Channel and then select Session default channel group
- Then, under the Dimensions value dropdown, select Organic Search and click OK
- Click Apply
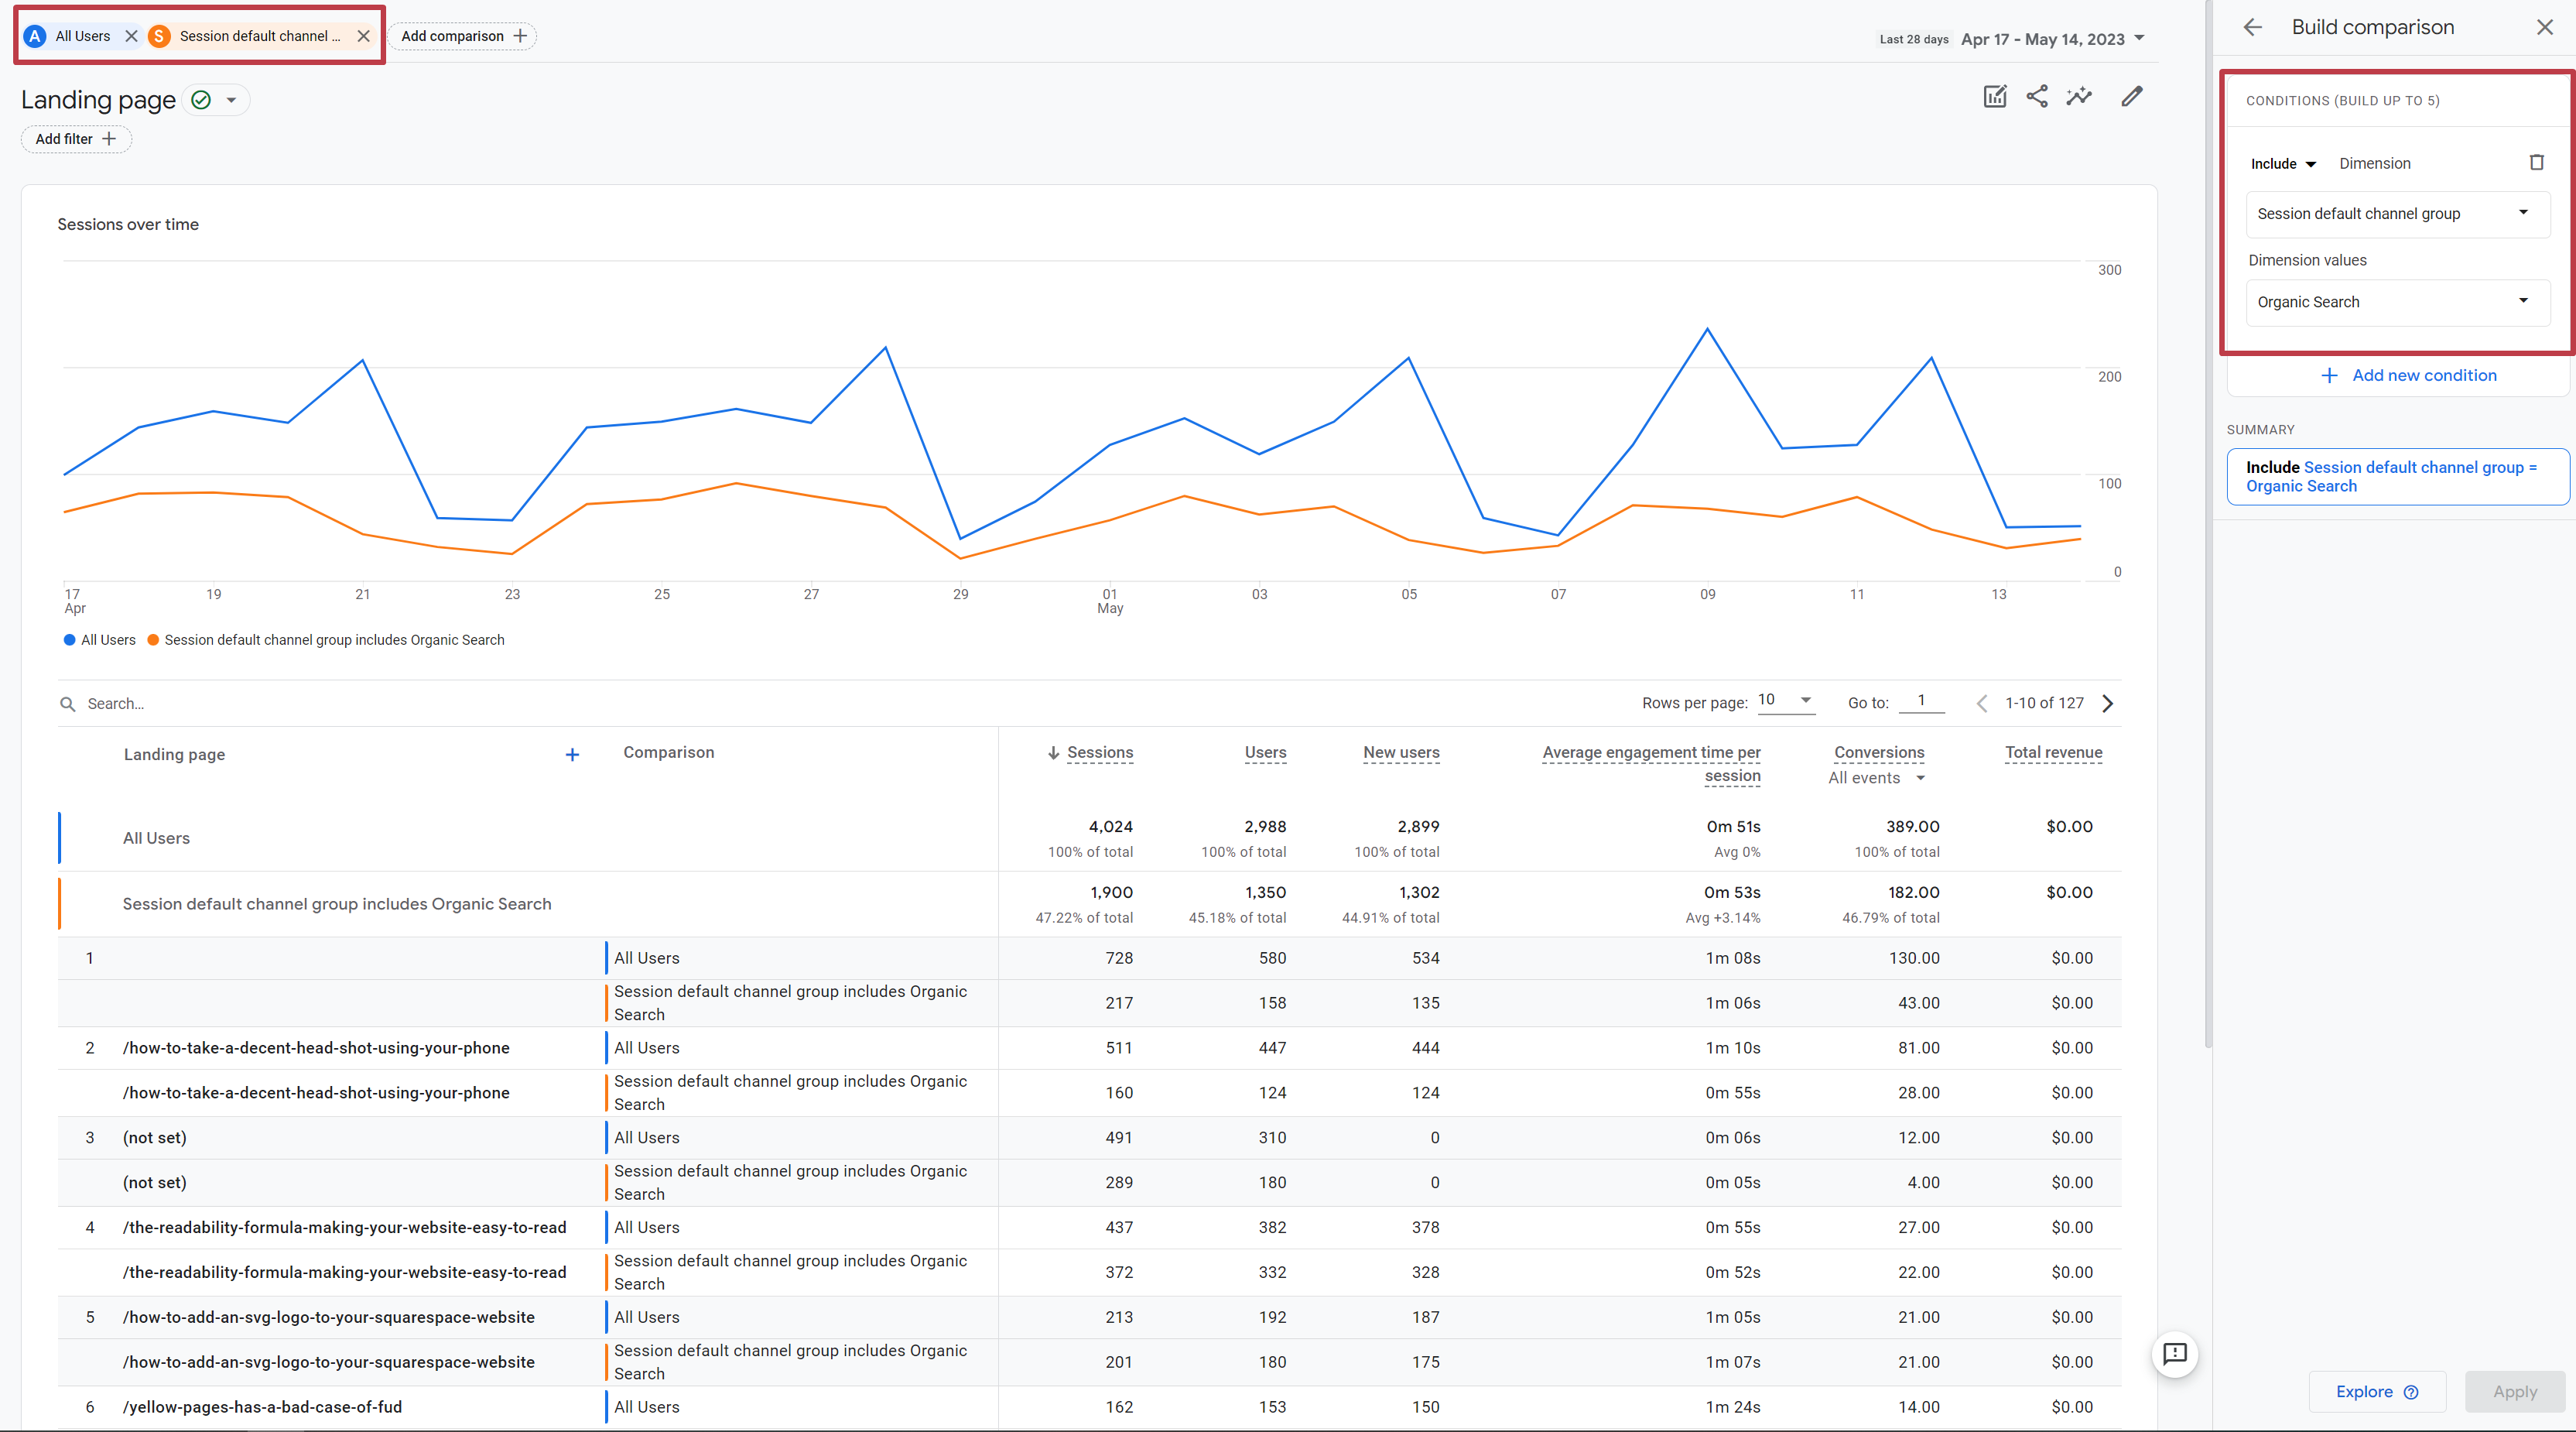
Now you can see that the report is showing both segments, All Users and Organic Users.
If you just want to see Organic Users, under the comparison panel on the right-hand side you would:
- Click the three little dots next to All Users
- Then, click Remove comparison
- Or alternatively at the top of the report view there will be tags so just click X icon next to All Users
Remember, if this is a report you use a lot, instead of having to make a comparison every single time, save the report:
- Click the Pencil icon to customize the report
- Add the Filter
- Click Save
I would recommend saving this as a new report so that anybody else looking for non-organic traffic can still easily find what they need.
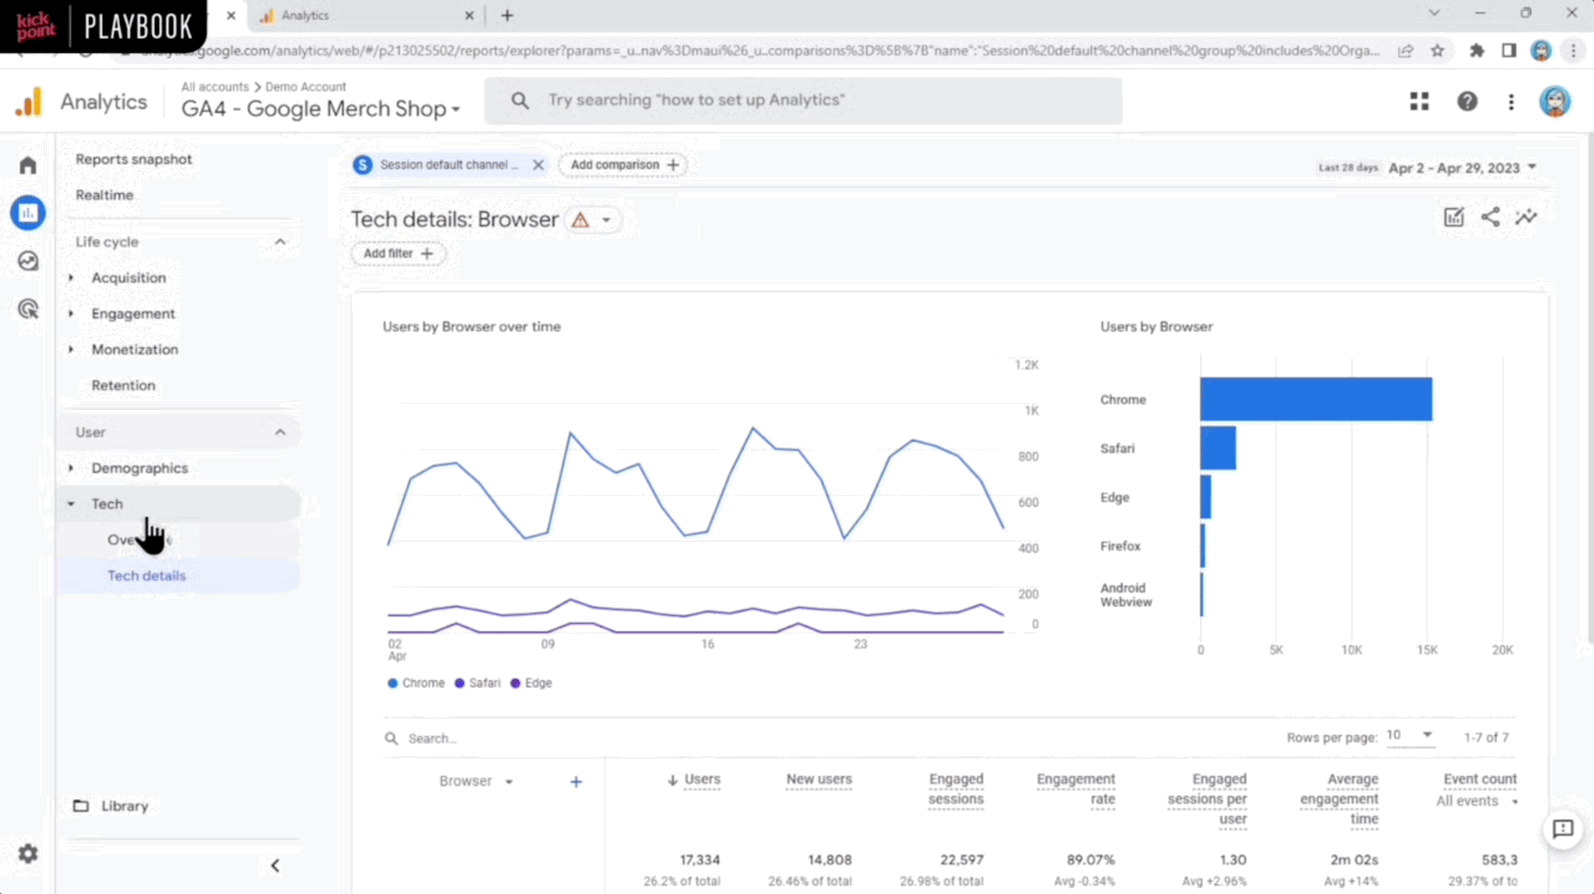
Devices Report
Let’s look at what devices people are using when browsing your site.
In UA, this report was towards the bottom of the audience section and it was under Mobile > Devices (even though it was able to show different types of devices, not just mobile devices).
In GA4, you’re gonna go to User > Tech > Tech details, and then in the dropdown you’re going to choose Device category (Browser is shown by default) to see a breakdown of desktop, mobile, and tablet devices. Again, if this is a report used a lot, you can make a custom copy and add it to a collection and add it to your report list.
Conversions
To end this off, let’s look at conversions.
Of course, conversion metrics are included in most reports, but what if you want to look a bit deeper? In UA, most of the time people would use the Goal Overview report, which is under Conversions > Goals > Overview. If you were digging a little bit deeper, you might go into Conversions > Multi-Channel Funnels > Overview.
In GA4, all of the conversion reports are under the Advertising section (in the main side panel – so not the Reports section), which is a little weird, because I guess they’re assuming everyone is running Google Ads? Which I’m sure Google would love, but not everybody is. Even if you aren’t running Google Ads, this is where your conversions are going to be.
There are two reports in Advertising under Attribution: Model comparison, and Conversion paths.
Model Comparison report
The model comparison report works quite a lot like the UA report did, where you can select two different models — in this case, it’s showing us, by default, the cross-channel last-click model and the cross-channel data-driven model.
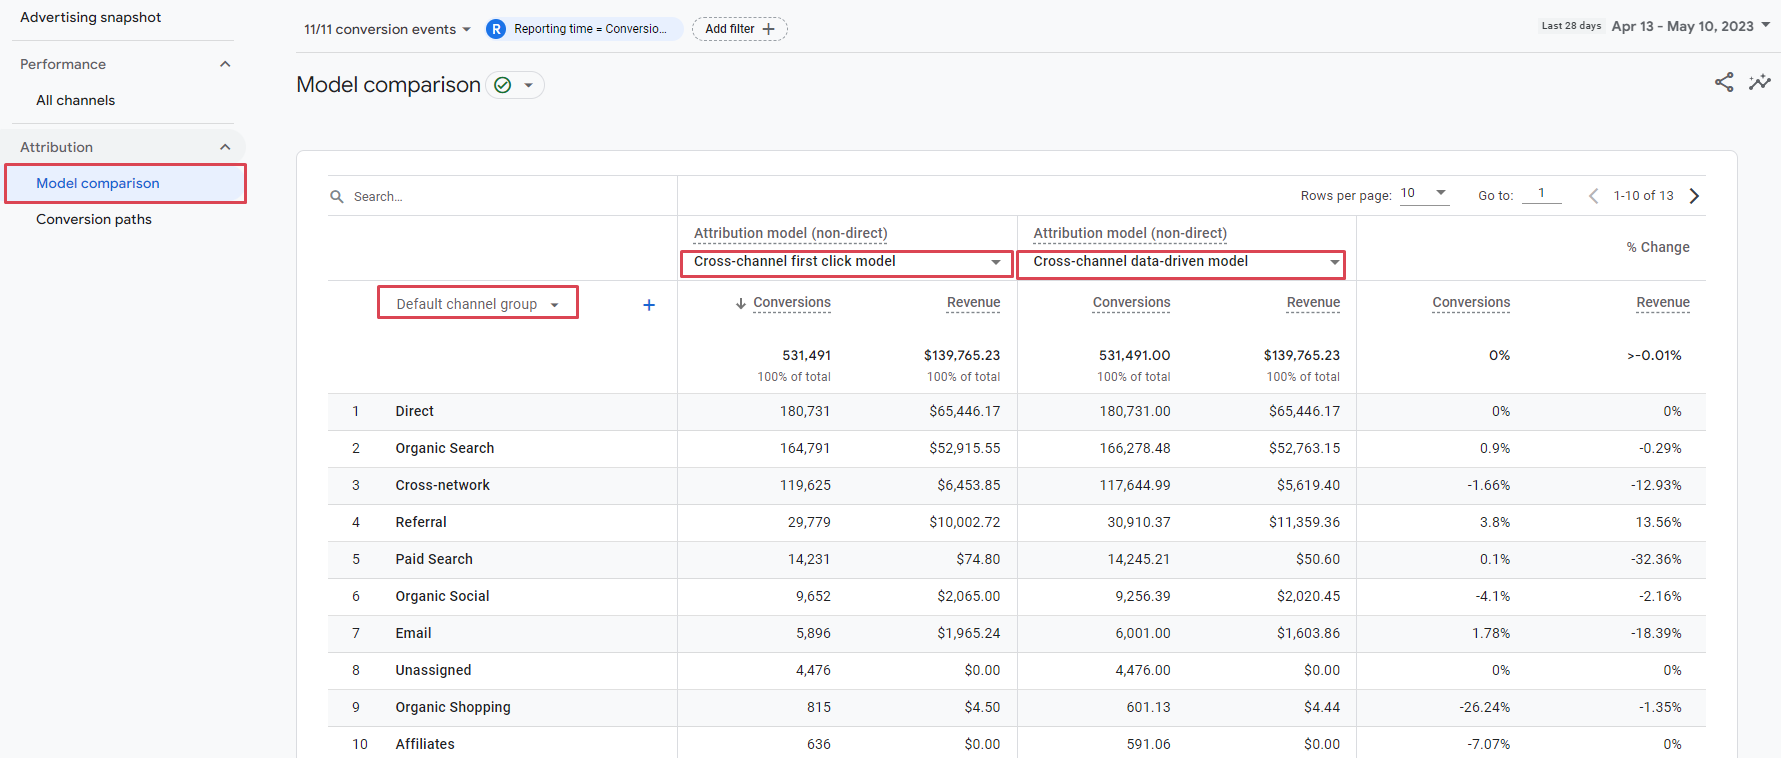
What if we wanted to change it to first click instead?
From the dropdown under Attribution model (non-direct) – Cross-channel last click model select First Click and it would show us the change in conversions in revenue, which is really similar to how this worked in UA.
Conversion Paths report
Under conversion paths, you can see where the touch points are based on the model you’ve selected. We’re using the default channel group, using the Cross-channel data driven model.
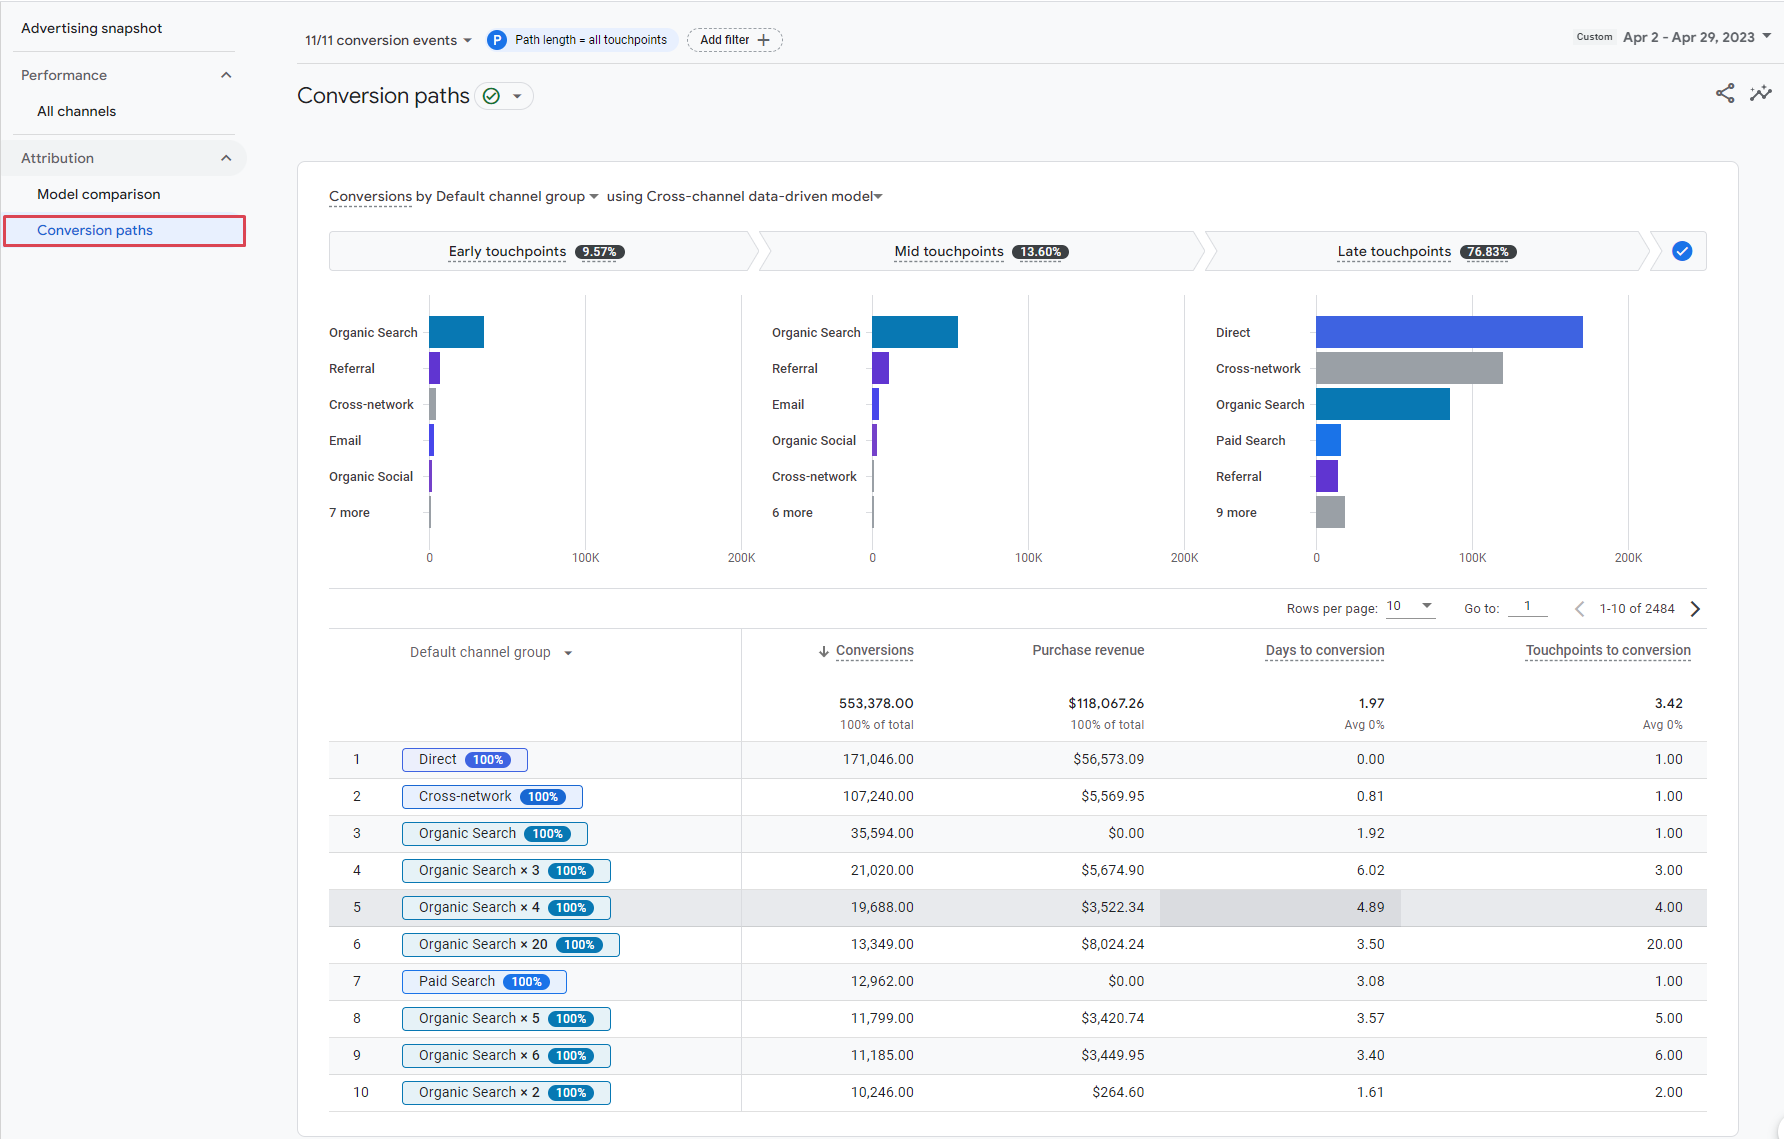
🤔 One thing that I find really weird about this report is that the header sections are exactly the same size, regardless of the percentage that’s early, mid, or late. Of course, the bars are bigger, but really I think that these sections should be bigger.
If the early touchpoints are only 9.5% of the traffic and late touchpoints are 76% of the traffic. Why isn’t the late touchpoints column 76% of the width of this particular report?
Really keep that in mind when you’re taking a look at these reports. You might need to look at percentages to see how much is actually early, mid, and late, instead of just visually thinking that it’s all equal, because it probably isn’t.
This overview will have set you on the right path for using reports in GA4, and now you should feel comfortable finding similar reports or even making your own reports based on what you looked at the most in UA!
Do you have more questions on reporting or GA4 in general? Let us know what topics you want us to cover in future resources. Thanks so much for watching and reading!
Looking to improve your analytics skills?

Dana enjoys solving problems that haven’t been solved before. With her 20+ years experience in digital marketing and teaching, she has a knack for distilling complex topics into engaging and easy to understand instruction. You’ll find Dana sharing her knowledge at digital marketing conferences around the world, teaching courses, and hosting a technology column.
Learn more about Dana