There is a common question asked in every analytics group these days and it’s “how can I import my Universal Analytics (UA) data into GA4?” Unfortunately, the answer is that you can’t. (Insert dumpster fire emoji here.) UA and GA4 use completely different data models and importing isn’t possible.
This confusion probably resulted from the language Google used to describe the move from UA to GA—phrases like “migrate from UA to GA4”. Migration does imply that you could move your data, so it’s no wonder that many people have questions about how to move data from UA to GA4.
Since you can’t move your data, what can you do instead? In this post, we’ll walk you through exactly how to blend UA and GA4 data together in Looker Studio (formerly Google Data Studio) so that you can present your metrics in one graph, combined between the two properties.
A caveat, before we get started: Common metrics like users and sessions are measured differently in UA and GA4. Your data will not match perfectly between the two, so it might be misleading to combine the two in a single graph. Please watch our video on GA4 vs UA: 8 Key Differences Explained for more information.
Get reporting help
Don’t have time to do this but need it for your reporting? Our experts can set this up for you.
Video Walkthrough
Creating your UA and GA4 data sources in Looker Studio
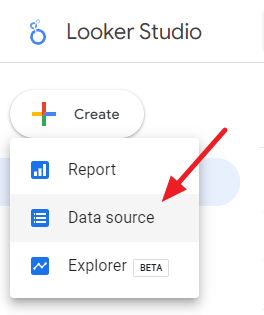
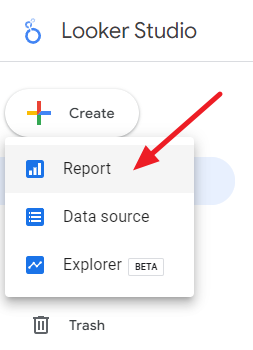
The first step to combine UA and GA4 data in Looker Studio is to add both UA and GA4 as data sources. To create new data sources in Looker Studio, click the Create button (at top left) and then click Data Source.
You’ll want to select the Google Analytics data source, and then go through this process for both your UA and GA4 properties. Make sure to name each property something unique so you can tell the two apart! We use the naming scheme “Data Type / Client Name” for data sources at our agency.
How to blend UA and GA4 data in Looker Studio
One of the best features of Looker Studio is the ability to easily combine two data sources together—such as UA and GA4. This is called data blending.
If you haven’t used data blending before, don’t panic! We’ll walk you through it step-by-step.
Add your UA and GA4 data sources
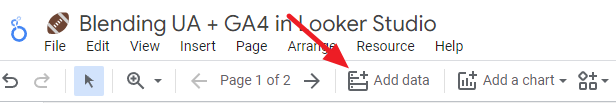
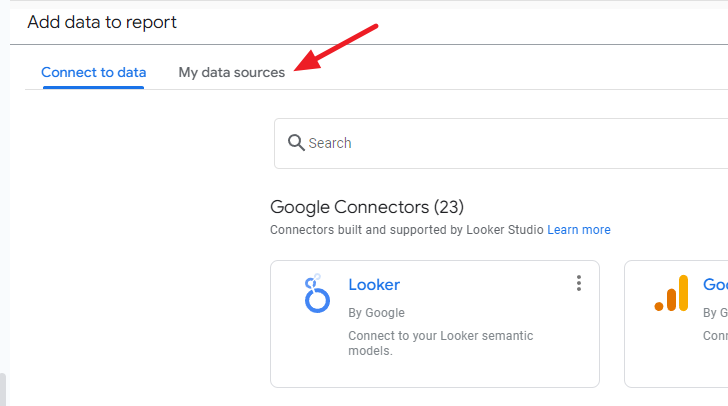
First, we need to add our data sources to a report. If you have a report you’re already working with, great, use that and add whichever data source(s) you need to that—you can do that by:
- Clicking on “Add Data” in the menu bar,
- Click “My Data Sources”,
- Select the source you need to add,
- Click “Add” at the bottom right.
If you need to create a new report, from the main Looker Studio screen, click “Create and then Report”.
You’ll be prompted to add data to your new report, click on “My Data Sources”, select the other source that you just created, then click Add at the bottom right.
Add tables with UA and GA4 data
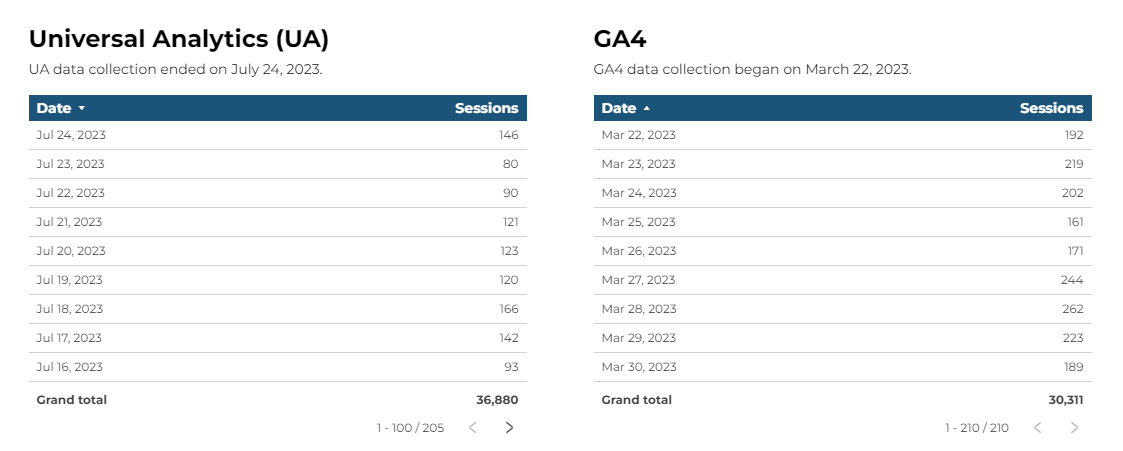
Before we blend data together, we like to display the data we’re going to blend in separate tables. Then we can be sure that our blend is working as it should.
In this example, we’ll be blending session counts between UA and GA4, so we have two tables, one for UA sessions, the other for GA4 sessions.
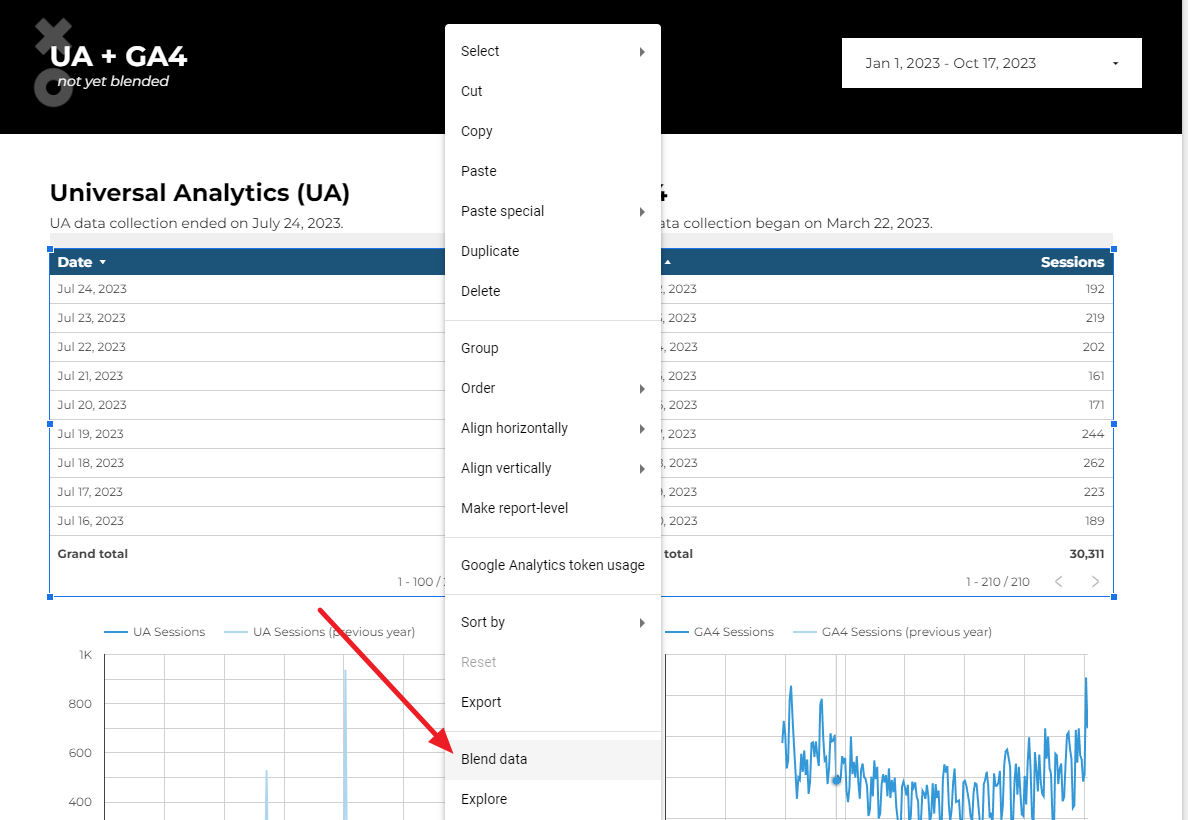
- Select both tables,
- Right-click, and select “Blend Data”.
You’ll be given a new table, with a data source called “Blended Data (1)”. What you get won’t look very helpful at all — we’ll fix that next.
Modify the data blend of UA and GA4
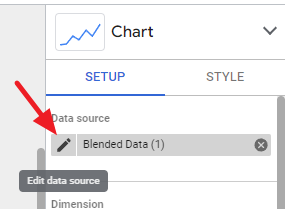
Click the “pencil icon” next to the data source name (“Blended Data (1)”) to modify it.
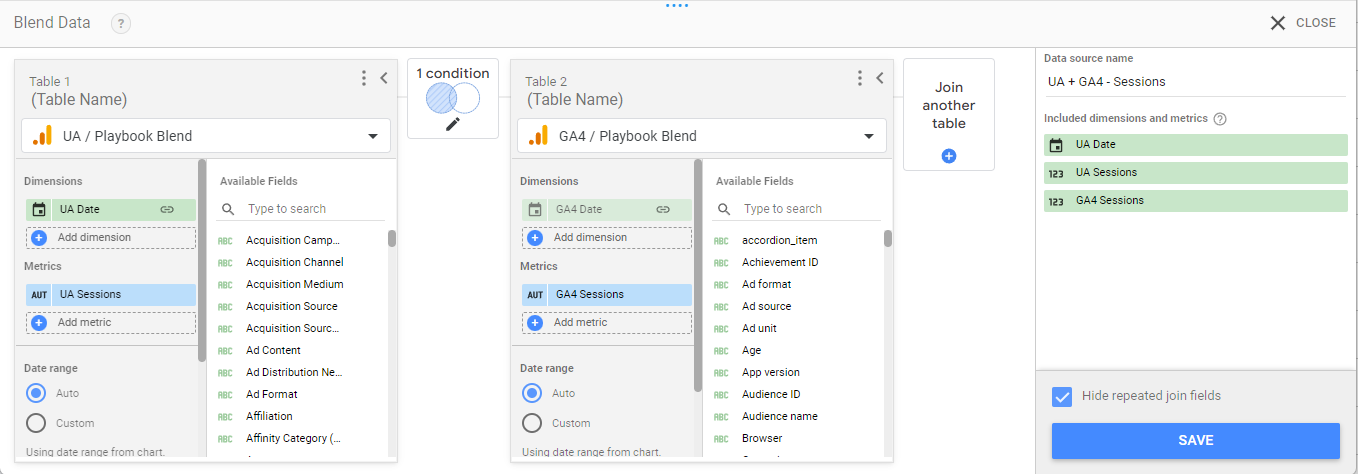
You’ll see a screen that looks like this:
Depending on which chart you selected first, you may see your GA4 data source on the left instead of the right. It doesn’t actually matter which source is on the left and on the right.
The first thing we’ll do is rename the dimensions and metrics, otherwise we won’t know what is coming from UA and what is coming from GA4 in our blended data set.
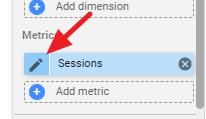
To rename a dimension or metric:
- Hover just to the left of the dimension or metric name and you’ll see a pencil icon come up,
- Click the pencil icon,
- Change the name to be clearer—we recommend naming the dimensions “UA Date” and “GA4 Date”, and rename the metrics “UA Sessions” and “GA4 Sessions”. If you use other names, you’ll need to revise the formulas we provide later in this post.
- Then in the data source name field (at right), rename it to be clearer than “Blended Data (1)”. Our naming scheme is typically what sources are involved in the blend, and then what metrics—for example, this would be named “UA + GA4 – Sessions”.
Your blend should now look like this:
Next, we need to change how the data is blended. By default you’ll end up with what’s called a Left Outer join—everything from whichever data source is on the left, and anything from the right data source that matches what’s on the left. But since your UA data did stop collecting data at some point, and your GA4 account likely hasn’t been set up for very long, you’re going to end up with problems where not all the data will blend together because of this Left Outer join limitation.
Instead, we need to use a Full Outer join. This brings in all data from both sources. To change the blend condition, click on the icon that looks like a Venn diagram between the two data sources (it will say “1 condition”).
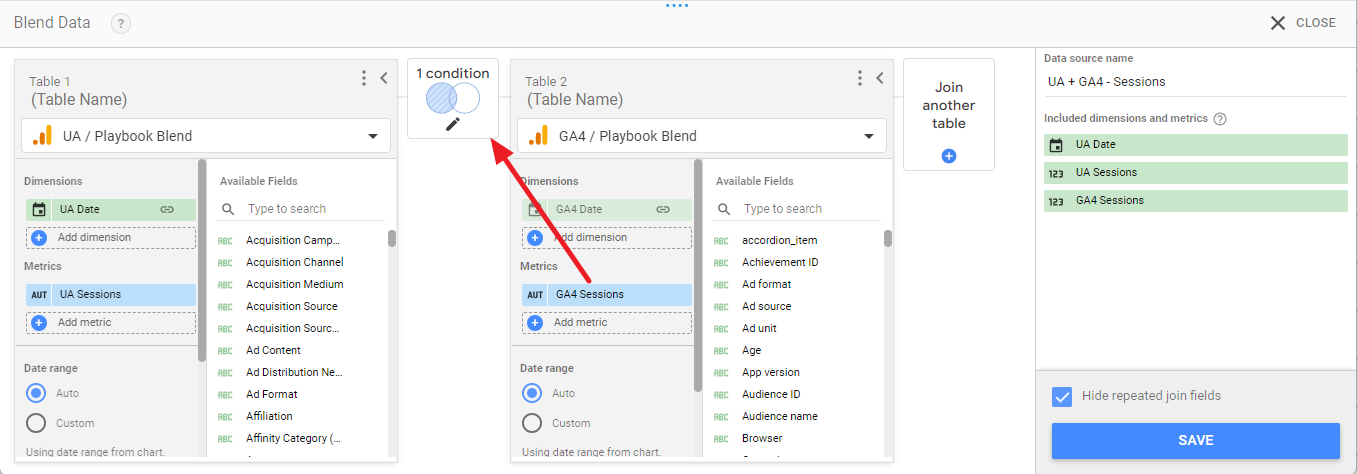
On the screen that opens up, select “Full Outer”.
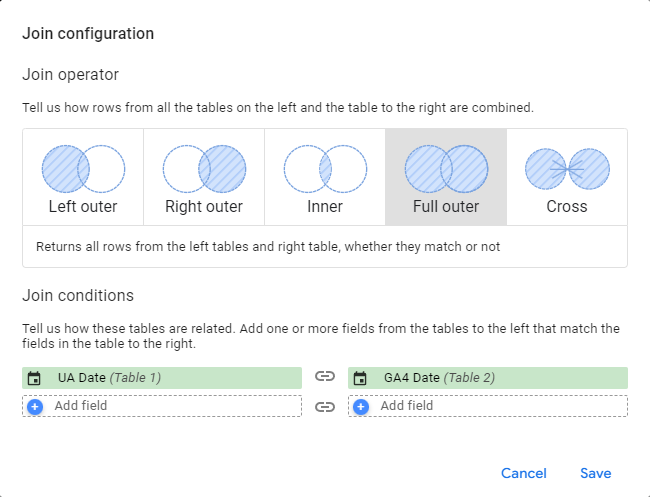
You may also need to reset the Join Conditions—select UA Date and GA4 Date as the joined fields as shown in the screenshot above.
📢 If you want to filter this data by a specific channel (e.g. just Organic Search traffic), we’ll cover how to do that later in this post.
Display both UA and GA4 in one table
Now let’s revise our table to show both dimensions and metrics:
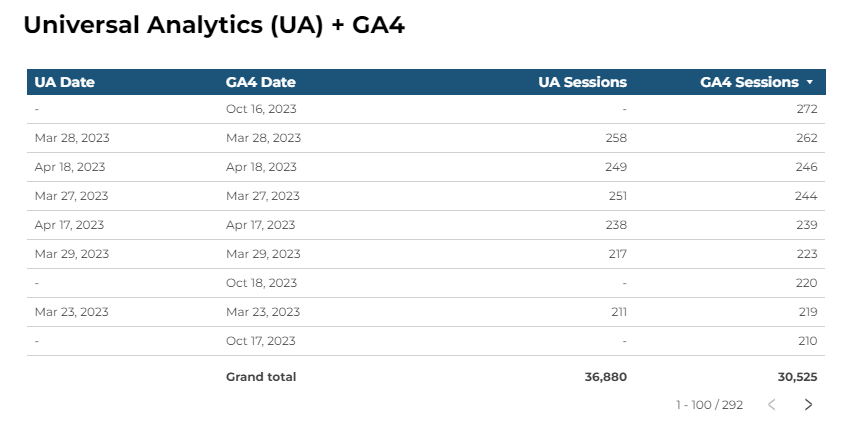
You can see how we don’t have a date or sessions for UA after the data collection cut off, but we do have a date and sessions for GA4. The opposite is also true, if you scroll through the table and look for dates before GA4 was added to the website.
What we actually need is a cutoff where we only use GA4 data after a certain date, and then use UA data before that date. For this client, their UA data collection didn’t shut off until July 24, 2023 but let’s switch the data on the actual UA sunset date—July 1, 2023.
Create calculated fields
In order to tell Looker Studio when to stop reporting UA sessions and instead start reporting on GA4 sessions, we’ll need to use calculated fields. There are two calculated fields that you’ll need to create.
Calculated date field – dimension
The first calculated field will be a dimension for the date.
- Click the plus symbol next to “Add Dimension”,
- Then click “Create Field”.
- Enter a name for the new dimension—we’re going to call ours “Coalesce Date” since that is the function we’ll be using for this calculation.
- In the formula box, copy and paste the code below:
COALESCE(UA Date,GA4 Date) - Click “Apply”.
Note that if you named your dimensions something other than UA Date or GA4 Date, you’ll need to adjust the formula.
Calculated session field – metric
The second calculated field will do the heavy lifting of deciding when UA or GA4 data should be shown, based on the date.
In the Metric section:
- Click the plus symbol next to “Add Metric”,
- Then click “Create Field”.
- Enter what you want this new metric to be named in the Name field—we typically call it “Blended Sessions” so that the client knows that this data is blended.
- In the formula box, copy and paste the code below:
CASE WHEN
CAST(FORMAT_DATETIME(“%Y%m%d”, COALESCE(UA Date,GA4 Date)) AS NUMBER) > 20230630
THEN GA4 Sessions
Else UA Sessions
END - Then click “Apply”.
Note that if you named your dimensions something other than UA Date or GA4 Date, and your metrics something other than UA Sessions or GA4 Sessions, you’ll need to adjust the formula.
How does this blending formula combine UA and GA4?
The first formula (for the date dimension) is just using one function—COALESCE. The COALESCE function in Looker Studio returns the first non-missing value in a list of fields. If we look at the Coalesce Date, we can see what happened:
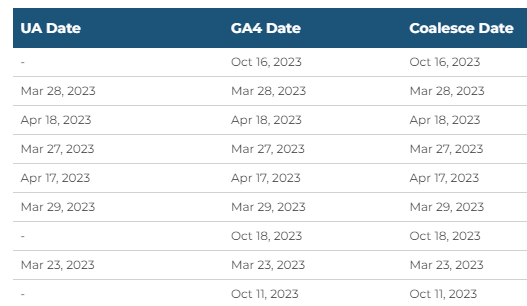
In the cases where we didn’t have a UA Date, the GA4 Date was selected instead. The opposite is also true—if a GA4 Date didn’t exist, the UA Date is selected. This way we ensure that we always have a date dimension returned for every day.
The second formula (for the sessions metric) is using several functions—
- CASE,
- CAST,
- FORMAT_DATETIME, and
- COALESCE.
This instructs Looker Studio which metric to use, based on the date.
The CAST function is used to turn every date into a number, that way we can set a cutoff date and then instruct Looker Studio to use different data based on dates being larger or smaller than our cut off date value. The FORMAT_DATETIME function helps us turn the date into a specific format—YYYYMMDD.
The CASE function is used to help Looker Studio make a decision on what data to return based on the date number. For example, our cutoff date is anything after June 30, 2023. This translates into the number 20230630. The date July 1, 2023 translates into 20230701, which is larger than 20230630, so GA4 sessions should be returned (the “THEN” part of the CASE function). The date June 29, 2023 translates into 20230629, which is smaller than 20230630, so UA sessions should be returned (the “ELSE” part of the CASE function).
If you wanted to use a different cutoff date, the only thing you need to do is change the number in the formula. For example, let’s say you want to switch from UA to GA4 on March 15, 2023—then change 20230630 in the supplied formula to 20230315. That’s it!
Now let’s take a look at our table again:
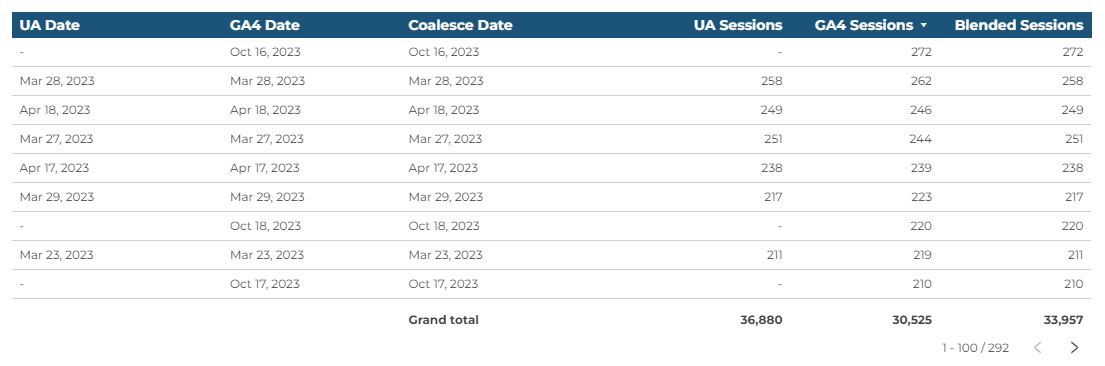
Similar to what we saw after we added the date field, we now have a session value on every single day. Scroll through your table and check that you’re seeing GA4 or UA sessions returned when you expect to see them returned.
Amplify your analytics game
Display UA and GA4 together in a Looker Studio chart or graph
A table isn’t the best way to display this data, though. Let’s instead use a time series chart.
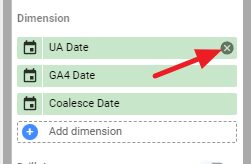
First, remove all dimensions and metrics from the table except for the two calculated fields that you created. To remove a dimension or metric, mouse over it and then click the X icon.
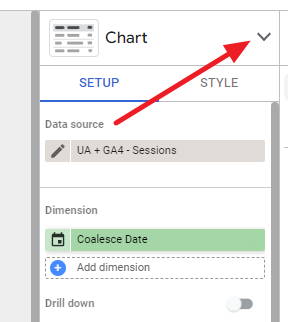
Then, with your table selected, click the “Chart” drop down at the top right:
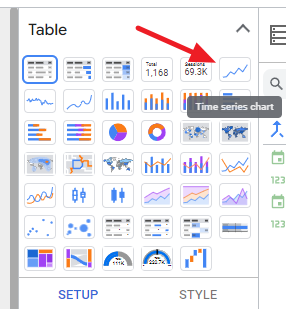
Select “Time Series Chart”:
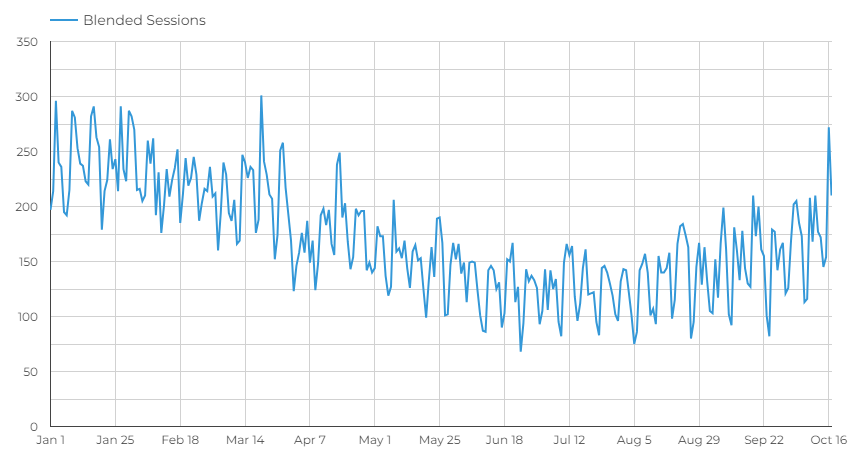
Now you have a single unbroken line, seamlessly transitioning from UA to GA4:
Add a date comparison
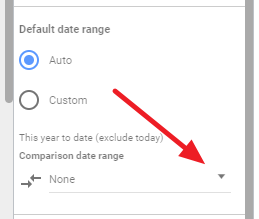
You can even add in a comparison to a previous period or previous year, even though we didn’t have GA4 set up last year. To do this, find the Default Date Range section of the chart Setup and then click the “Comparison Date Range” option:
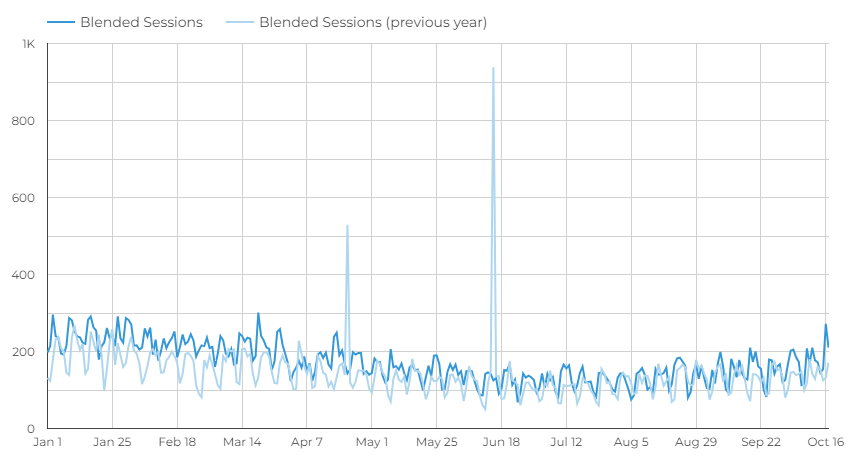
Now we can compare our data against last year’s sessions:
Filtering UA and GA4 data by channel
What if you need to filter this data? For example, let’s say you only want to report on sessions that are attributed to one specific channel, such as Organic Search. To do that, we’ll add filters to our blended data source.
If you still need a graph that shows all sessions in addition to this filtered set of sessions, you don’t want to modify the blend we just worked with as that will impact your other graphs as well.
Instead, we’ll make a copy of this blended data source that we will then filter. To do this:
- Click on “Resource”,
- Select “Manage Blends”,
- Then click “Duplicate” next to the data source you need to copy.
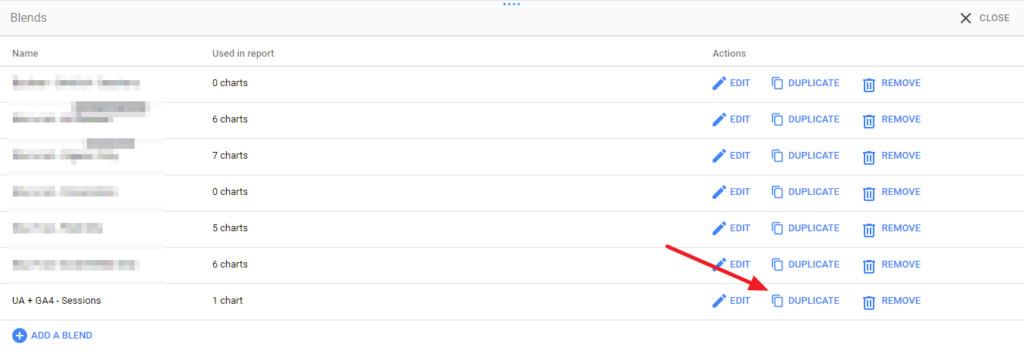
- Once that is created, click “Edit” to modify it.
Now in our duplicated blend, we’ll want to rename it so that we know which is which. We’ll rename this blend to “UA + GA4 – Organic Sessions”.
Then, we’ll add filters to our data sources:
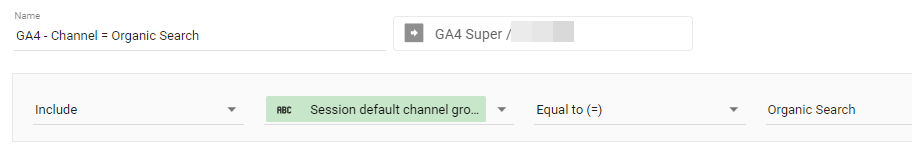
- Under each data source, click “Add a Filter”. Here is what these filters will look like:
UA Filter
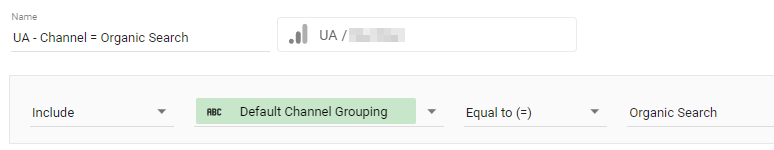
GA Filter
- Once those filters are applied, click “Save” on your data source, and then you are all set!
How long can you use Universal Analytics (UA) data in Looker Studio?
UA data will be available until July 1, 2024—then it will be gone forever. You’ll want to move it out of UA before that date so that you can continue to access it. There are a number of different ways to export your data out of UA, but one method we recommend is Analytics Canvas’ UA Backup service. Once you have moved your data out of UA, you can then set up data sources and blends for wherever your UA data is now stored, such as BigQuery or a Google Sheet.
Become an analytics expert

Dana enjoys solving problems that haven’t been solved before. With her 20+ years experience in digital marketing and teaching, she has a knack for distilling complex topics into engaging and easy to understand instruction. You’ll find Dana sharing her knowledge at digital marketing conferences around the world, teaching courses, and hosting a technology column.
Learn more about Dana