If you’re going to be able to derive insights and decide on actions from your analytics data, you need to know that you can trust your data. There will be times when you question the reliability of your data in Google Analytics and this is why it’s important to audit your GA4 account to ensure accuracy. In this video we show you how to audit your GA4 account using our Looker Studio Dashboard, what to look for, and important red flags.
Need a GA4 Audit?
Do you need a Google Analytics audit and don’t have time to learn how to do it yourself? Our experts can help.
When to Use the GA4 Audit Dashboard
We recommend that you use this dashboard when:
- You’re learning GA4 and want to look at the most important data at-a-glance
- Google auto-migrated your Universal Analytics property to GA4 and you need to know if you should keep the auto-migrated property or create a new one
- You get access to a new GA4 property and need to know if it’s set up correctly
- You’re seeing odd issues in your GA4 property and aren’t sure what’s going on
- You need to confirm that your ecommerce configuration is capturing everything that it should be
Audit Categories to Review
The best part is that since this GA4 Audit Helper Dashboard is built in Looker Studio, we don’t need access to your data — when you open the dashboard, you can select any GA4 property that you have access to, or you can make a copy of the dashboard and save it to your own Google Account for your use.
This GA4 audit dashboard is inspired by a Universal Analytics audit dashboard, created by Charles Farina. Thanks Charles! 👏
There are 5 pages in the dashboard, each covering a different aspect of your GA4 data:
One important thing to know is that we didn’t include anything in this dashboard that would require you to set up any custom dimensions as we wanted this to be as accessible as possible for everyone. Of course, if you make your own copy of the dashboard you can add in whatever custom dimensions make sense for you and your situation.
Lastly, note that this dashboard is built for people using GA4 for website analysis, not app analysis. You can certainly try it out for your app data in GA4, but no guarantees that it will be as useful!
Acquisition
A common issue we see with acquisition data is poorly managed sources and mediums, which can result in your traffic getting lost in the dreaded Unassigned channel.
Unassigned is what GA4 calls any traffic that doesn’t match their default channel groups and it’s where good traffic often disappears in a sea of unrelated sources and mediums.
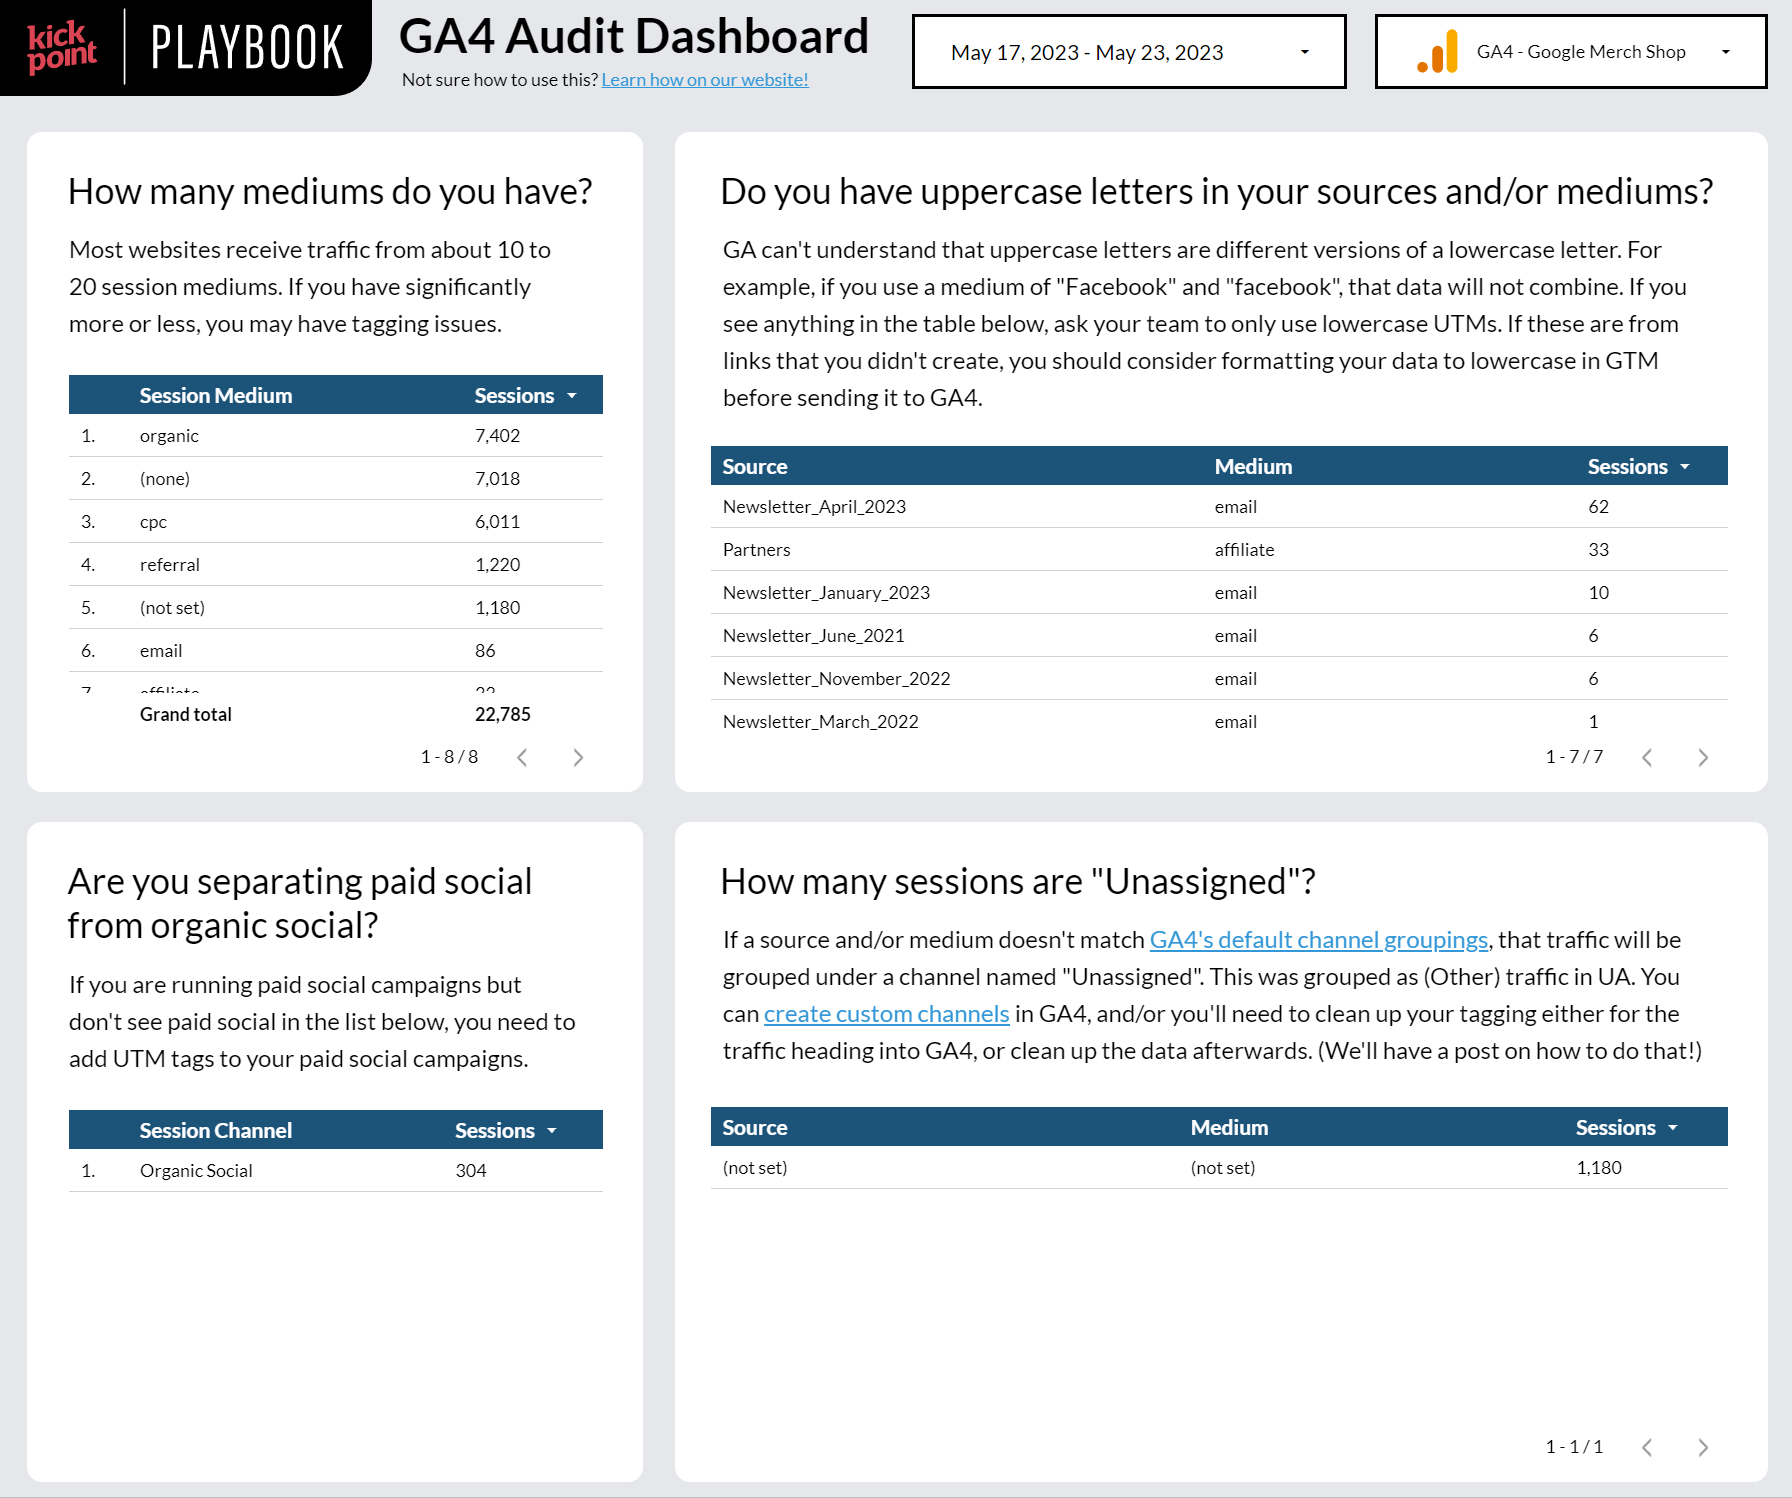
How many mediums do you have?
What you see as the channel in GA4 is actually a combination of medium and source.
- Medium – what category the traffic falls into
- Source – where specifically the traffic comes from
Here are some examples:
| GA4 Channel | Medium | Source |
|---|---|---|
| Organic Search | organic | |
| Organic Social | social | |
| Paid Social | paidsocial | |
| Organic Video | video | youtube |
If you have too many mediums, you’re more likely to end up with traffic in the dreaded Unassigned channel (more on that later). Realistically, there are only about 10 to 20 mediums that any site will use on a regular basis — more than that and you’re more likely to run into traffic that’s sorted incorrectly.
Do you have uppercase letters in your sources and/or mediums?
GA4 is case sensitive, which means that it does not combine uppercase and lowercase versions of the same word. As far as GA4 is concerned, “Facebook” and “facebook” are two completely different things. And this isn’t just a GA4 issue, it’s been an issue for as long as we’ve had Google Analytics. The best way to avoid running into this problem is to only use lowercase UTM parameters in your URLs.
- For example, don’t use this: https://kpplaybook.com/?utm_medium=referral&utm_source=KPPlaybook&utm_campaign=Campaign+Name
- Use this instead: https://kpplaybook.com/?utm_medium=referral&utm_source=kpplaybook&utm_campaign=campaign+name
Of course, anyone can use UTM parameters when they send traffic to your site, so sometimes you may run into the situation where a well-meaning website or newsletter is happily sending you traffic with mixed-case URLs or UTMs — or worse, both!
The best thing to do in this case is to force the page_location parameter in GA4 to be lowercase only, and you can do that in Google Tag Manager. Not sure how to do this? We’ll definitely add a video on this topic in the future, or we’ll cover this in more detail in our Analytics for Agencies course.
Are you separating paid social from organic social?
One very nice new feature in GA4 is the existence of a Paid Social channel. This is something that you would have had to set up manually in UA so we’re very excited that it’s built in now! If you’re running any social ads, you should see two channels listed in this table — Organic Social and Paid Social. If you don’t, you’ll need to add or correct the UTM parameters in your social ads. GA4 doesn’t know if someone came to your site via a social ad or not unless you tell it, via a UTM parameter.
How many sessions are “Unassigned”?
As we mentioned earlier, Unassigned is what GA4 calls any traffic that doesn’t match their default channel groups and it’s where good traffic often disappears in a sea of unrelated sources and mediums. You don’t want traffic to end up here!
We’ve seen situations where a client had a really great converting ad or referral source, but because it was stuffed in a dumpster of Unassigned garbage, they didn’t know that they should be spending more budget or effort on that acquisition source.
What you likely will see here is at least one source/medium combination: (not set) and (not set). Why is some traffic showing up as (not set)? Julius at Analytics Mania has a nice overview of some possible issues. If you aren’t using the measurement protocol or audience triggers (you’d know if you were using these things!), and you know your UTM parameters are solid, then it may be due to a missing session_start event in GA4. It’s currently unclear why this is happening, but if you do see it, it should only be a very small part of your overall traffic. We’ll be sure to update this post in the future if we have any more details to share on (not set) sources and mediums in GA4.
Other than the (not set) issue, check for other sources and mediums in this table and revise or correct your UTM parameters accordingly. Of course, someone else might be using these incorrect UTM parameters and you can’t do much about that, except perhaps create a custom channel grouping — if there’s enough traffic to make that worthwhile. Remember you (currently) only get two custom channels to work with!
Elevate Your GA4 Skills & Knowledge
Pages
Pages are just that — what pages on your site did visitors view? Since this data is critical to helping you make decisions about your website content, we want to be sure that it’s as accurate as possible.
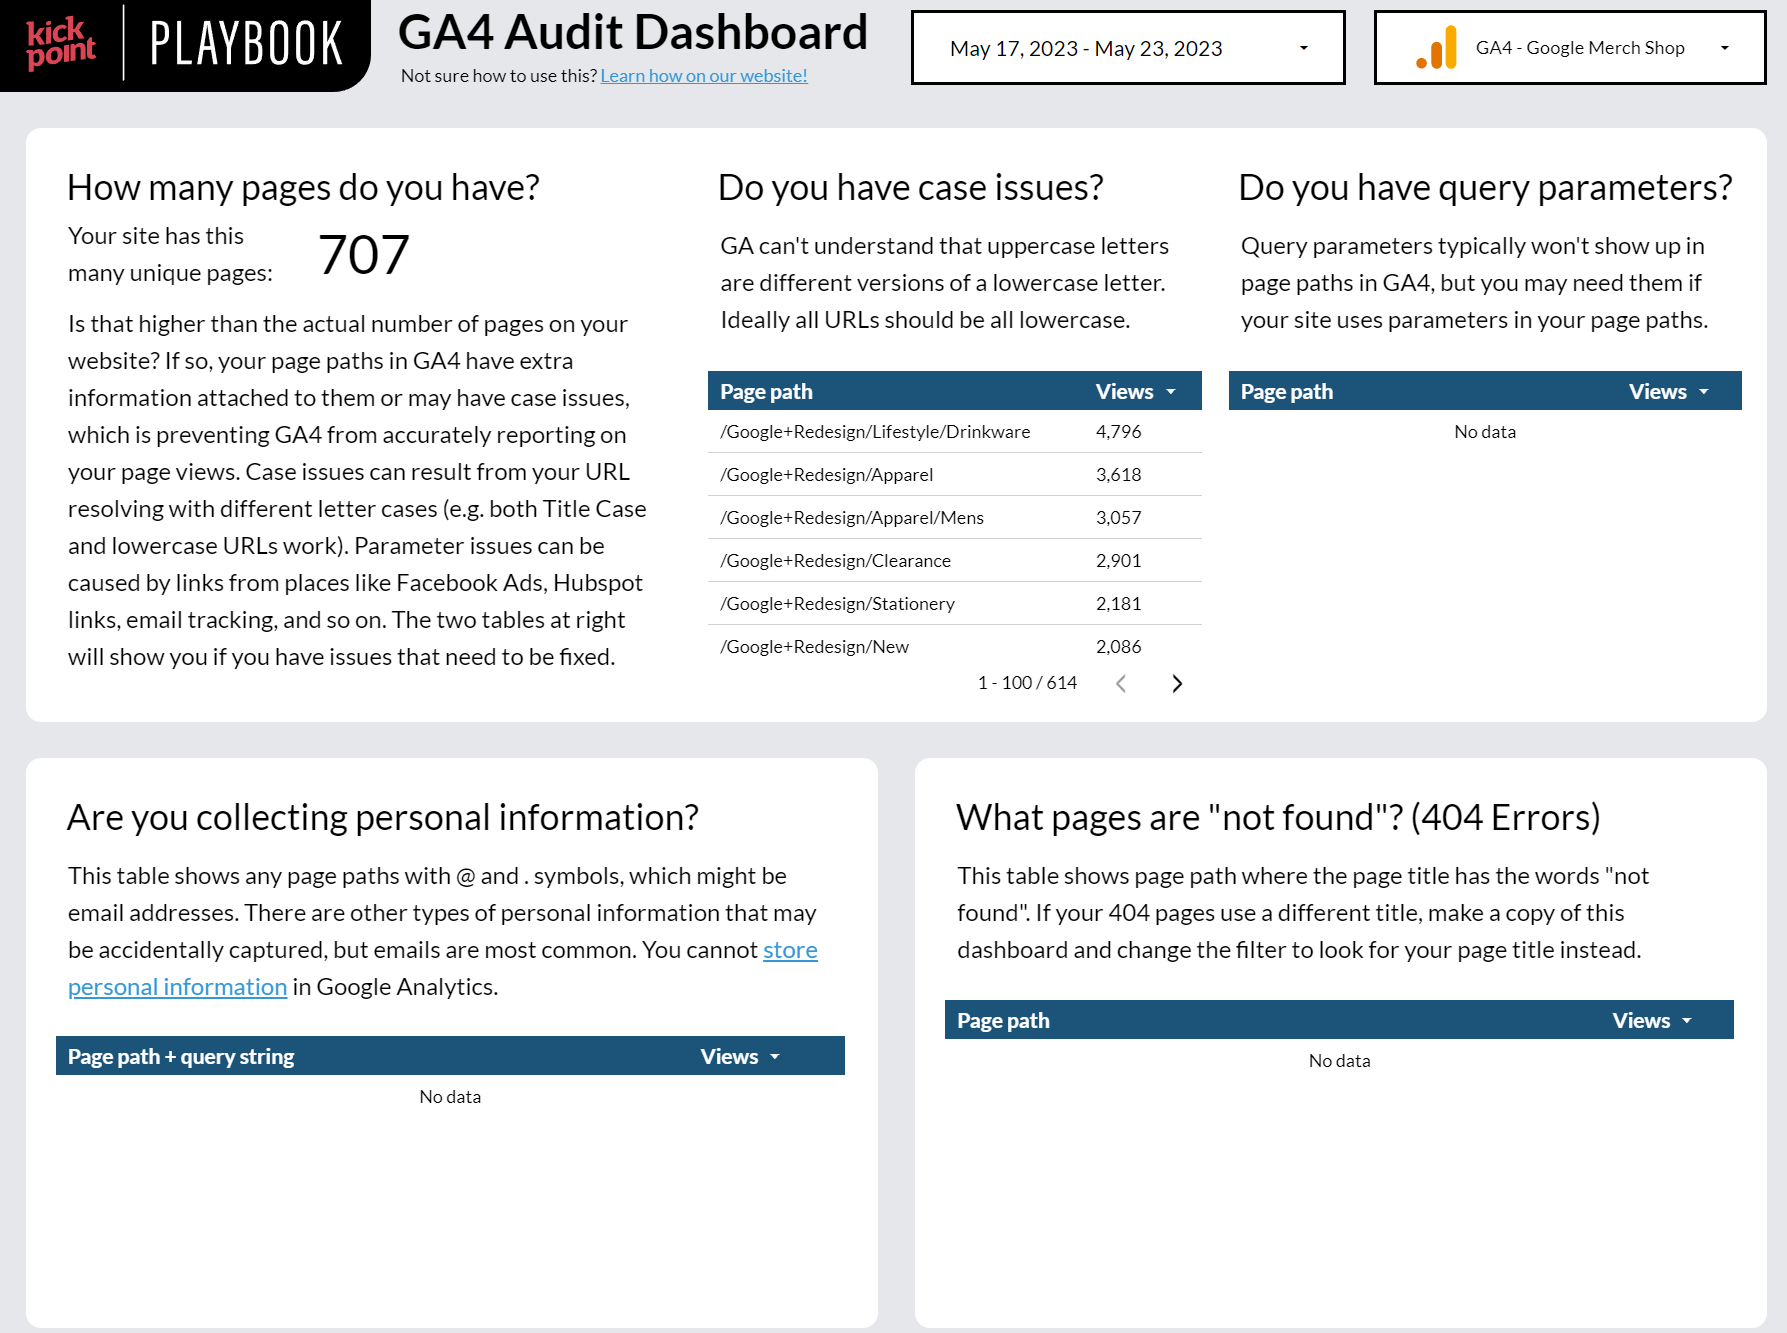
How many pages do you have?
The number here is counting the number of unique page paths that were found in GA4 in your selected time period. This probably won’t equal the number of pages you actually have on your website since not every single page of your site would be visited every single day — and if that is actually true for you, tell us your secrets — but it definitely shouldn’t be higher than the actual number of pages on your website.
If it is, this means that you’re probably running into case or query parameter issues on your site that need to be resolved, either on-site, or before you send your data off to GA4.
Do you have case issues?
The first possible problem is similar to the case-sensitivity issues in Acquisition. You can run into the same problems with your pages if your website’s content management system doesn’t force all your URLs to be in lowercase. You don’t have to use lowercase if you wish, but you want to make sure it’s consistent. We have some clients where their CMS forces them to use Title Case URLs. Unusual, but it’s consistent and that is what matters.
If you see page paths listed here and you don’t have a CMS that’s forcing lowercase, or Title Case, or (hopefully not) UPPERCASE, then you will either need to fix that issue in your CMS or force your data to lowercase before sending it to GA4.
Do you have query parameters?
If you aren’t familiar with the term “query parameters”, a query parameter is added to the end of a URL by using a ? and = signs. For example:
- This is a URL with query parameters: https://kpplaybook.com/?newsletter=true
- This is a URL without query parameters: https://kpplaybook.com/#newsletter
Typically query parameters are used to indicate filtering or a traffic source. For example, you may have noticed when we were looking for possible UTM issues, those UTM parameters are also query parameters. GA4 will automatically remove UTM parameters before saving the page path, but other parameters will not be removed.
This is also website-specific. Your website might use query parameters in URLs for specific pieces of functionality such as a search or filter, and if so, you’ll see lots of page paths show up here. But in many cases, the parameters are being added by products such as Hubspot, or links from Facebook. Whether or not this is a problem for you depends on how your site is built.
In many cases, you’ll end up using the Page Path dimension in GA4, which automatically removes the query parameters for you. But if you need to use the Page Path + Query String dimension in GA4 — for example if your site uses parameters for functionality — then you’ll run into issues where these extra parameters can cause your total page view counts to be fragmented across these “versions” of your pages with query parameters.
Here’s an example of how query parameters can cause page view issues:
| Page Path + Query String | Page Views |
|---|---|
| /catalog/?product=t-shirts&hsa_acc=3482345 | 26 |
| /catalog/?product=t-shirts&hsa_acc=3486789 | 14 |
| /catalog/?product=t-shirts&hsa_acc=3481234 | 4 |
Instead of seeing all 44 views for /catalog/product=t-shirts as a single row, now you’re seeing those views split across these 3 separate URLs. This can cause your page view reports to underreport how many views your pages are actually getting and impact your conversion rate metrics.
Are you collecting personal information?
You cannot collect personal information in Google Analytics, no exception. But sometimes a website may be passing personal information in a URL and then GA4 will dutifully record that information, resulting in personal information inside of Google Analytics. This table will identify any page paths with query strings that contain @ and . characters, which can indicate an email address. We’ve seen this happen with third-party systems, such as booking systems, and the developers were not aware of these restrictions in Google Analytics.
If you do see any information in this table, you’ll need to fix the problem that is sending data to GA4 in the first place, and submit a data deletion request.
What pages are “not found”? (404 Errors)
This table assumes that the title of your 404 error page contains “not found”. If that isn’t the case, make a copy of this dashboard and edit the filter on this table to match the title of your own 404 pages. Of course, you want to avoid 404 errors when possible, but sometimes bots may also visit random pages on your site, or you want a page to return a 404 in the case where you no longer offer that service or product. Don’t feel that you need to correct every single 404 in this table — based your decisions on what makes the most sense in your own situation.
Events & Conversions
Events are the heart of GA4. Dimensions such as what pages are viewed, purchases that are made, where a visitor started on your website are all based on events. This is why it’s critical to ensure that your event configuration is consistent and makes sense, not just to yourself, but to anyone else who might also be looking at your analytics in the future.
Events are very flexible in GA4, and while Google has recommended event names, the event names that you end up using are entirely up to you. Without guidelines in place for event naming, events can get messy, very quickly.
We recommend and use the “object action” model of event naming, in snake_case (all lowercase, spaces are replaced with underbars). What does “object action” mean? Think of an item on your website as an object — a piece of content, a form, a video. Then, what actions can occur with that object? Content could be read, a form could be submitted, a video could be played.
Based on those object action combinations, we would end up with these event names:
- content_consumed
- form_submit
- video_start
Additionally, events can be created via Audiences. When you create an audience, you have the option to add an audience trigger — this is an event that would be recorded when a visitor becomes a member of that audience. We separate out audience events from other events by prepending aud_ at the front of the event name, to make it clear how that event was created.
Finally, if you were automatically migrated from UA to GA4 by Google, you might end up with very messy event names, and we have a video talking about the issues with auto-created events.
This page will help you see if your events are following an established naming structure, and if you have near-duplicate events or incorrectly recording events that need to be tidied up.
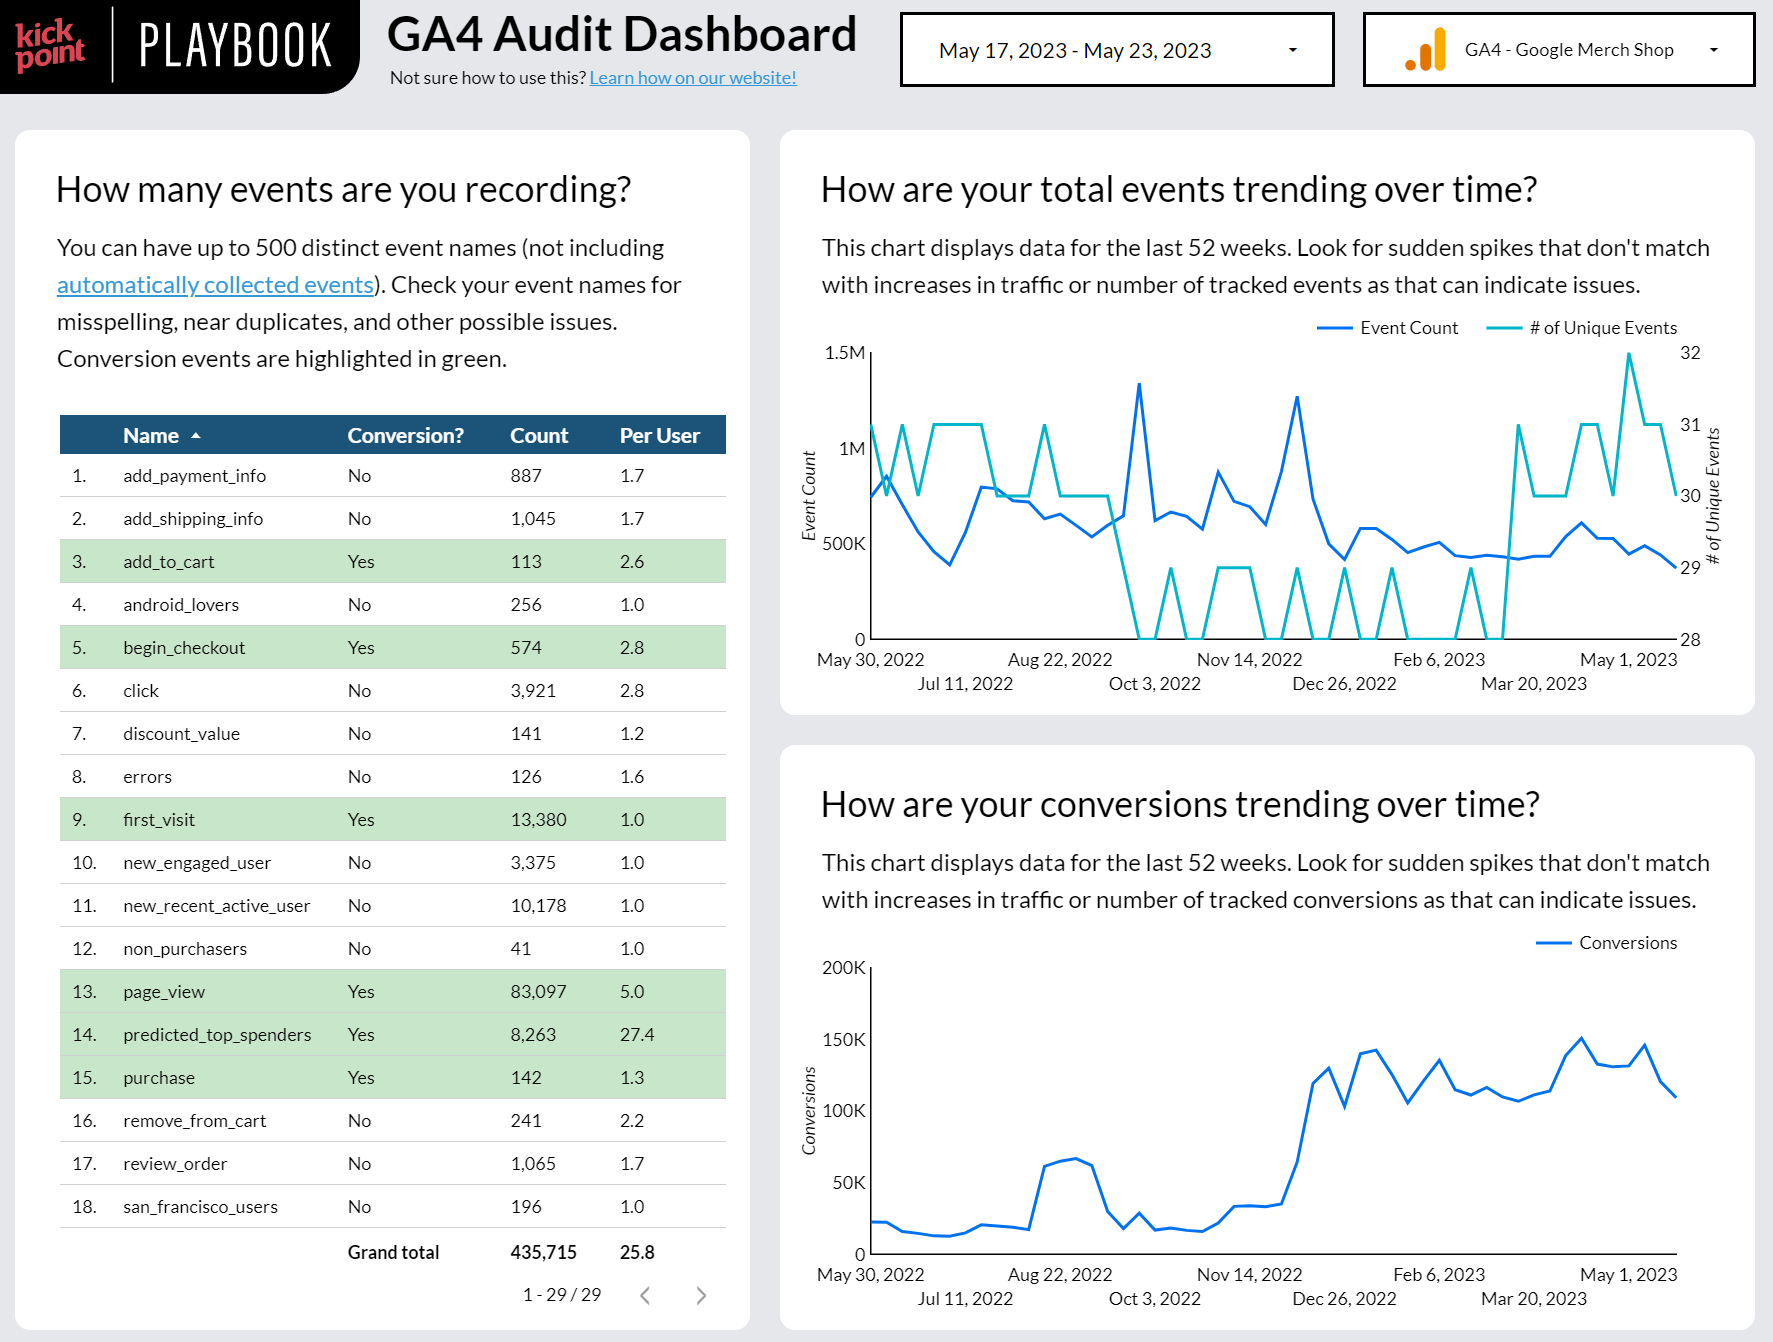
How many events are you recording?
While you can have up to 500 events in GA4 (not including automatically collected events), you probably don’t actually need to use all of them.
Use this table to
- check for near duplicate names (e.g. scroll vs scroll_down),
- misspellings, and
- other issues that can cause you to have more events than you should.
How are your total events trending over time?
Use this chart to look for big changes in the number and volume of events that you’re capturing.
If you see the total number of events captured going up significantly but the number of unique events didn’t change, you might have issues such as something has changed on your website and now you are creating too many events accidentally. For example, we’ve seen this in cases where we’re tracking clicks of a specific button and a developer changed all the buttons on the website to appear the same, resulting in a lot more button clicks being tracked than what we intended.
How are your conversions trending over time?
Conversions (goals in Universal Analytics) are based on events, which means that if you have event tracking issues, you may also have conversion tracking issues.
Use this chart to look for sudden spikes in the number of conversions recorded that don’t correspond with increases in traffic or changes to conversions — that can indicate tracking or configuration changes.
It’s very easy to turn on conversions, even for standard events, such as page views. While you can make every page view a conversion, we don’t recommend it.
Conversions should be focused on your business goals — if that action helped your website achieve your business or organizational goals, then it’s a conversion. Otherwise, it’s just an interesting observation and doesn’t need to be marked as a conversion.
Looking to Advance Your Analytics and Reporting Skills?
Overall Data Quality
This page of the dashboard looks at a number of different data points in GA4 to determine if you have data quality or hygiene issues that need to be addressed.
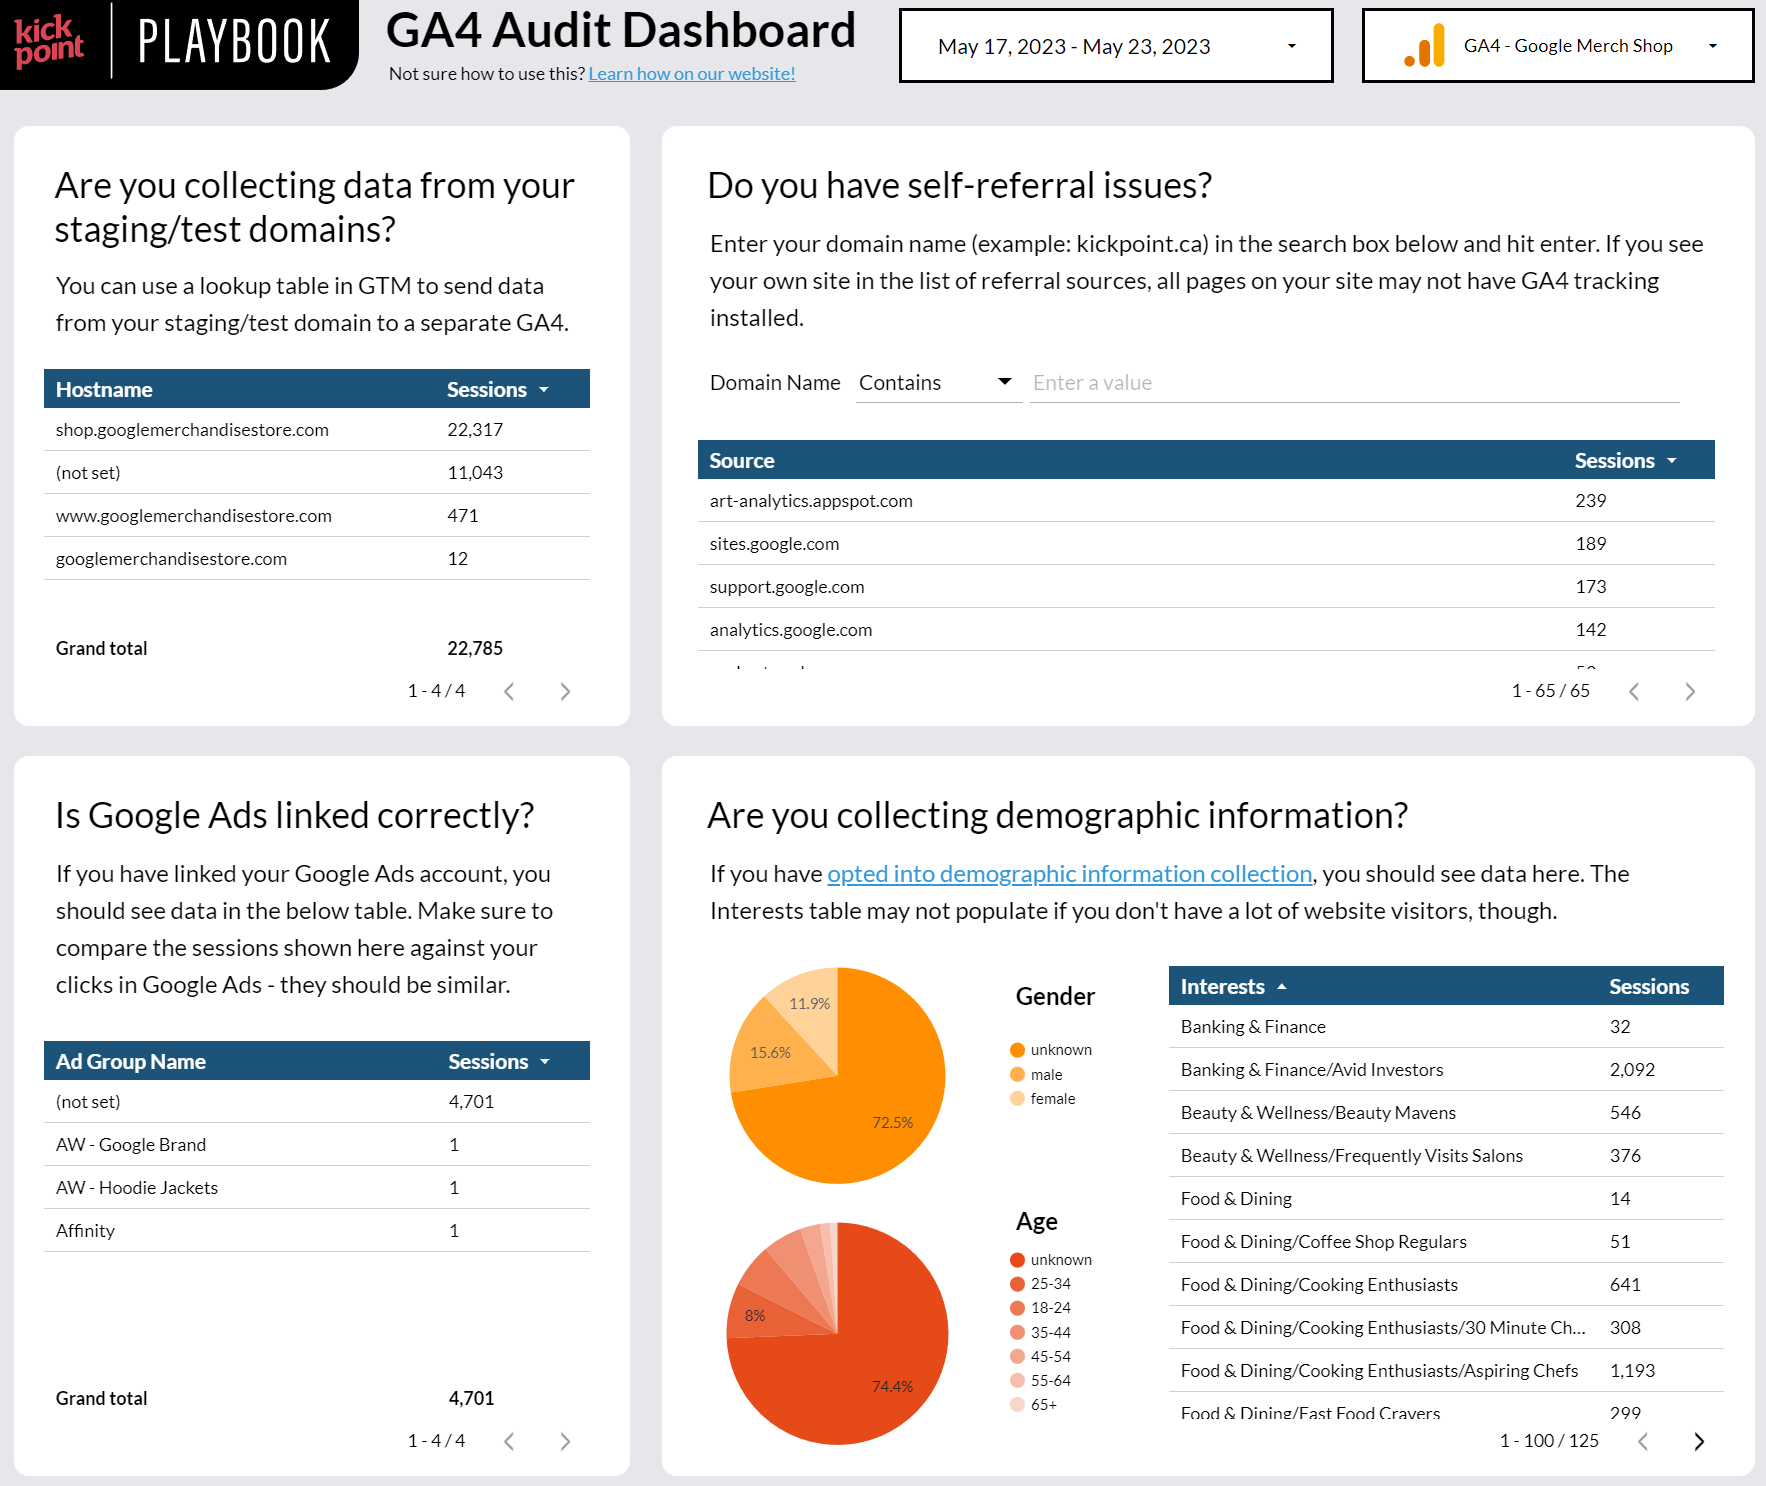
Are you collecting data from your staging/test domains?
We want to avoid sending data from staging or test domains to your live/production GA4 property, as tests such as developers checking form fills, your team editing content, and so on, can skew your analytics data, especially on lower volume websites.
This table shows you all the hostnames that sent traffic to your GA4 property. If you’re seeing staging, test, or unrelated domains in this table, you may want to change how data is sent to GA4. We typically use a lookup table variable in Google Tag Manager to choose which GA4 property to send data to, based on the hostname. Not sure how to do this? We’ll definitely add a video on this topic in the future.
Do you have self-referral issues?
Enter your own domain name into the search box and hit enter to see if it shows up in the list. Only add the hostname without slashes or the http part. For example:
- This is a hostname: kickpoint.ca
- This is not a hostname: https://kickpoint.ca
If you see your own domain showing up there, you should add your own domain in the tag settings section in the GA4 admin (details can be found here).
📣 Important Note: Sometimes self-referrals can be a sign of something else wrong with your data, such as a page that is missing tracking in the middle of a checkout flow, resulting in users disappearing and then reappearing on your site. Make sure to investigate where these self-referrals are coming from before changing the tag settings to ensure that technical fixes are not required as well.
Is Google Ads linked correctly?
If you use Google Ads, don’t forget to link Google Ads to GA4! If you have successfully linked the two, you should see ad groups in this table. Compare the number of sessions shown in this table against your click data in Google Ads — it won’t match up but it should be somewhat similar.
If it isn’t, you’ll need to find that missing traffic, such as landing on redirects that may be stripping referrer details, or landing pages that are missing GA4 tracking.
Are you collecting demographic information?
If you have turned on Google Signals, you should see demographic data in this section, including gender, age, and interests. This section is intended to check if Google Signals data is being collected, if it is turned on. Not everyone can use Google Signals, and you should check with your own privacy regulations in the geographic areas that you serve before turning on Google Signals.
eCommerce
The last page of the audit dashboard is entirely focused on ecommerce, so if you don’t have an ecommerce website, you aren’t going to see any data showing up on this page. If you have an ecommerce website and you’ve set up ecommerce tracking, you should see data here.
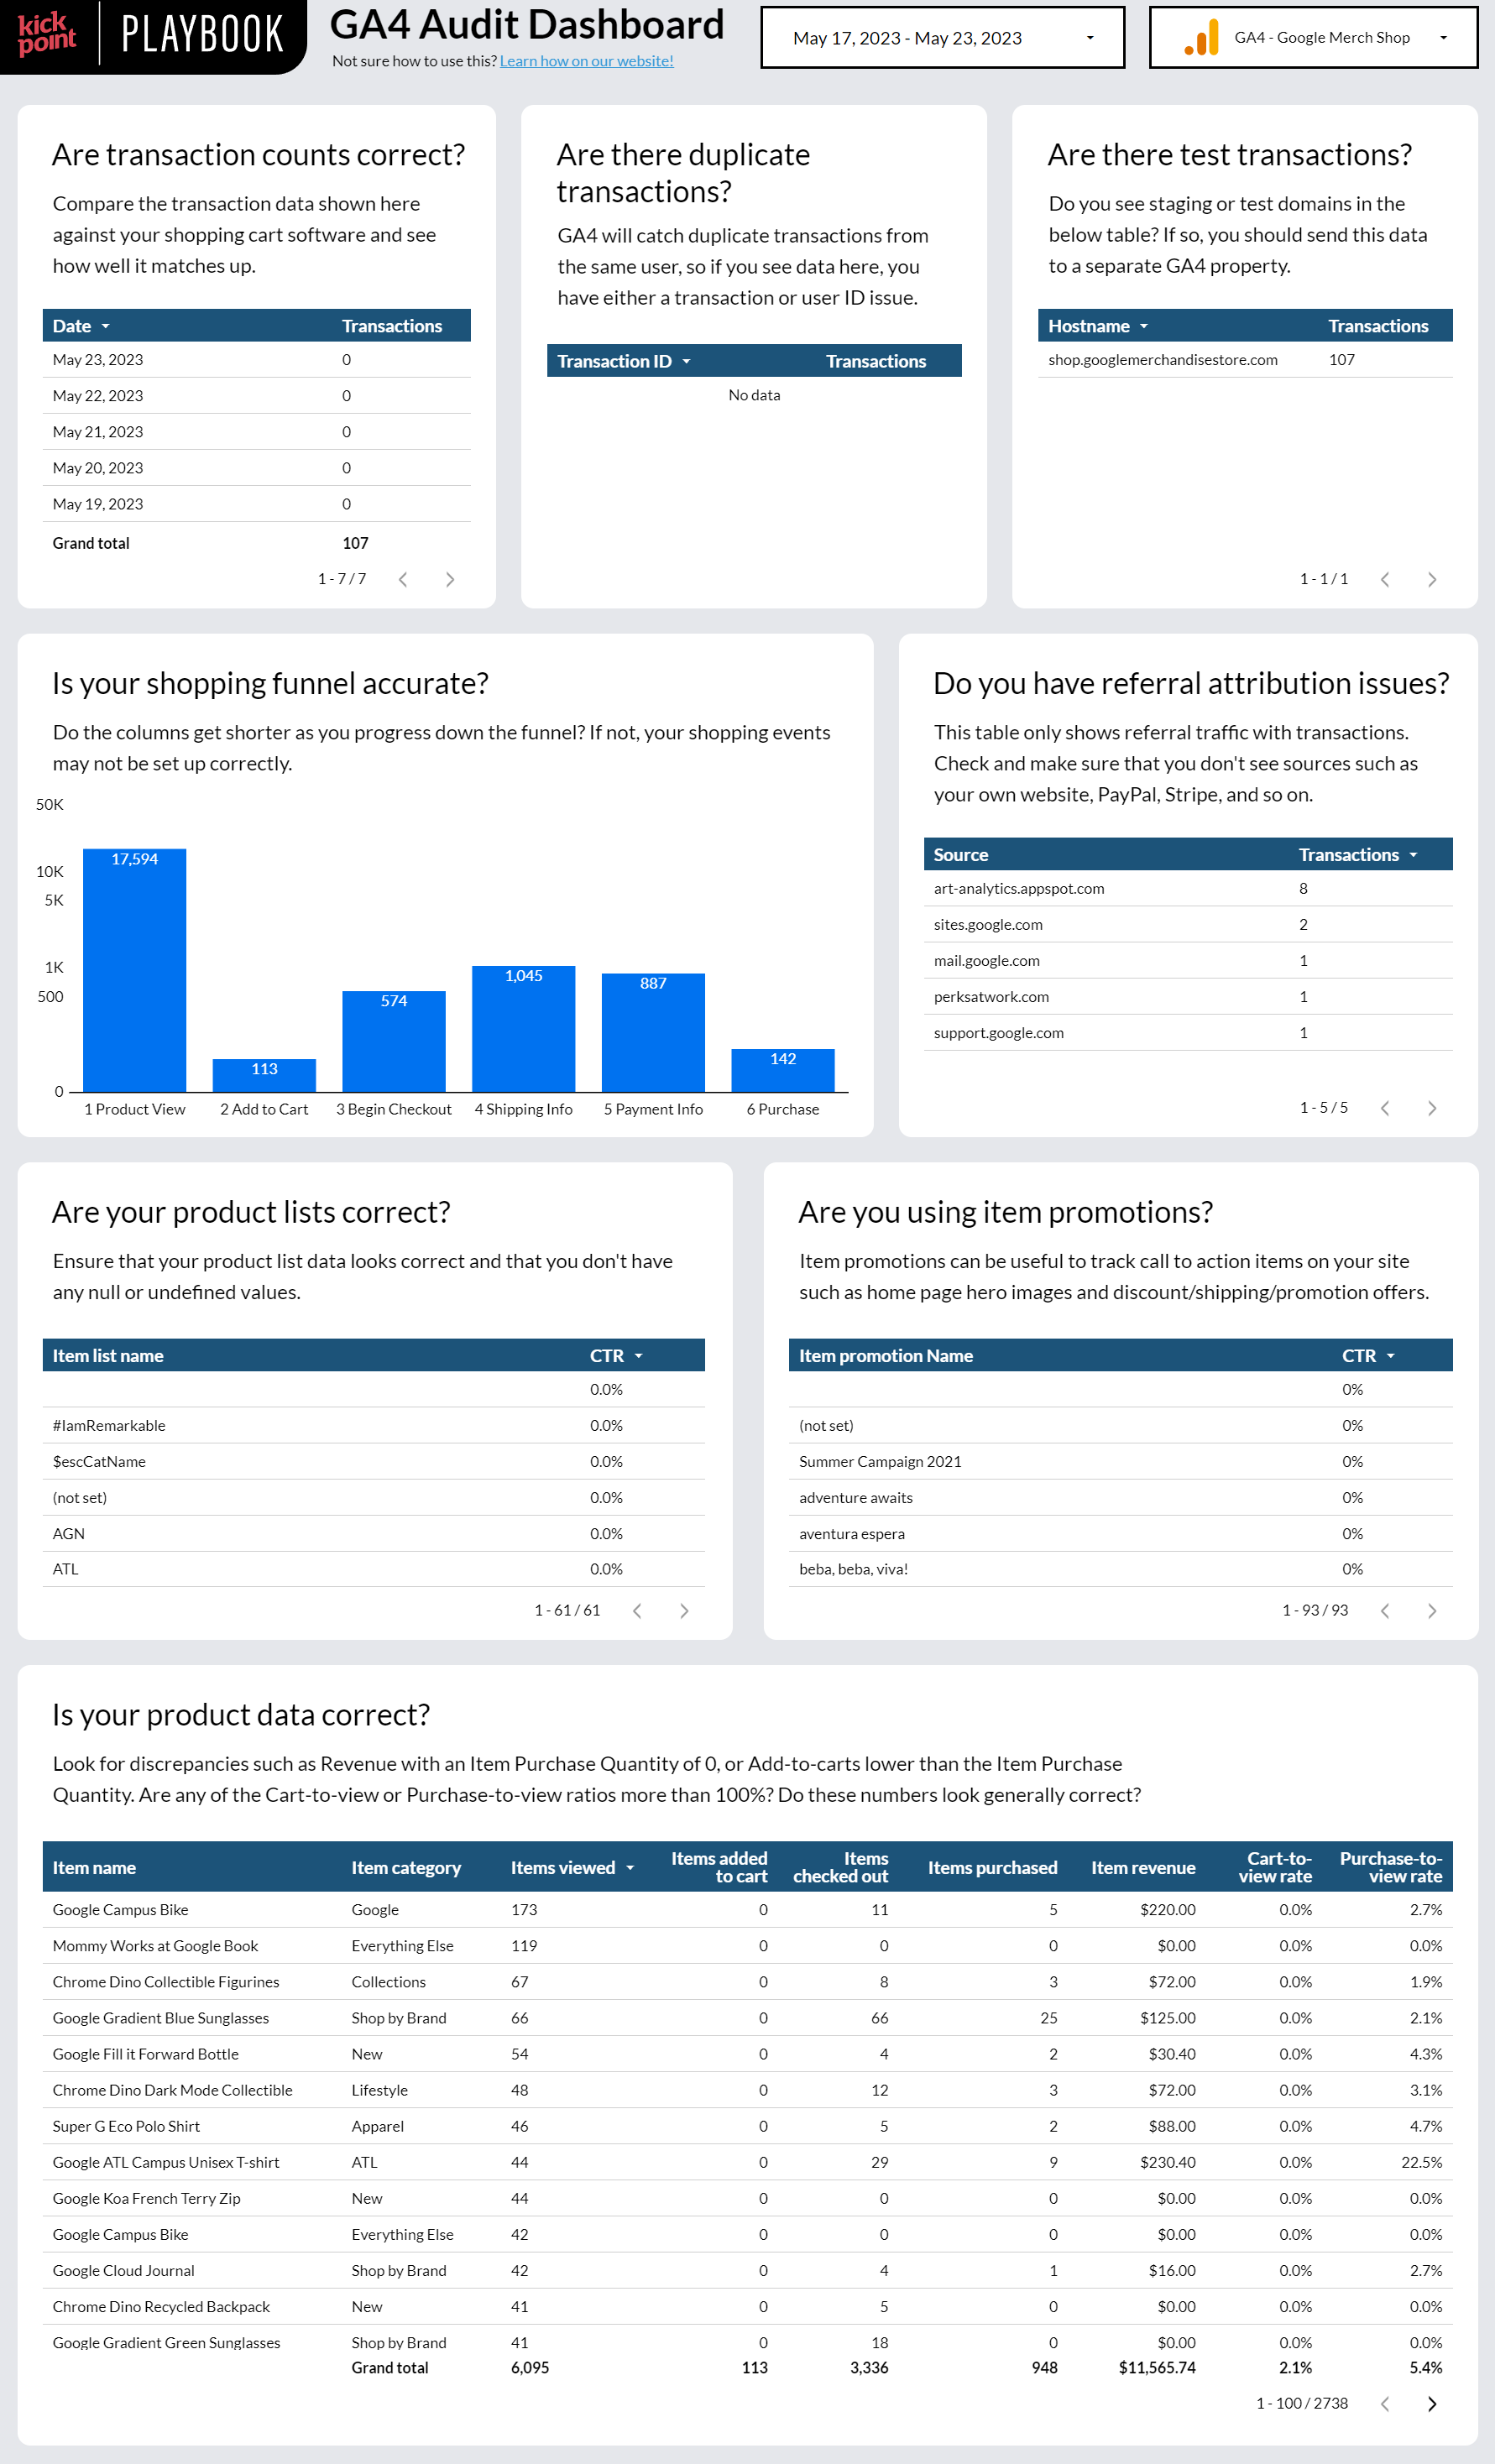
📣 Important Note Regarding Revenue: If you use a currency other than USD on your website, GA4 does a very odd thing where it converts your revenue amount to USD, and then back into your selected currency when you view the data. This will result in changes between the currency collected from your customers and what you end up seeing in GA4, especially if you transact in a currency that has rapid fluctuations against USD. You can view the original amount recorded by looking at the event value, but this is a very odd decision and we hope that GA4 changes this behavior in the future.
Are transaction counts correct?
Check the number shown in this table against what you’re seeing in your ecommerce software — these numbers should be relatively close. You won’t see transactions in GA4 from users who are blocking or did not consent to analytics tracking.
Are there duplicate transactions?
Tracking a transaction more than once was a common problem in Universal Analytics. GA4 does prevent duplicate transaction IDs being recorded by the same user. However, if you have issues with duplicate transaction IDs issued to multiple users or other configuration issues, you’ll see transactions in this table.
Are there test transactions?
If you’re collecting data from staging or test domains, you’ll end up with more transactions than you should in your reports. See the section on “Are you collecting data from your staging/test domains?” for more information on how to correct this issue.
Is your shopping funnel accurate?
The GA4 shopping funnel is made up of these events:
| Funnel Stage | Event Names |
|---|---|
| Product View | view_item_list view_item |
| Add to Cart | add_to_cart |
| Begin Checkout | begin_checkout |
| Shipping Info | add_shipping_info |
| Payment Info | add_payment_info |
| Purchase | purchase |
You should see a typical funnel progression from steps 1 to 6. If you see that some steps have lower amounts than they should (for example, you have 100 people beginning checkout, but 150 people adding shipping information) you may have a misconfiguration issue to investigate.
Do you have referral attribution issues?
This table shows the referral source for any transaction attributed to the Referral channel. What you should not be seeing in this table is your own domain name, and if you do, you’ll need to see if there is a step in your checkout flow that is not tracked by GA4 (this is common with Shopify, for example). You can also add your domain as a referral exclusion — see “Do you have self-referral issues?” for more information.
Are your product lists correct?
If you are using product lists in your ecommerce tracking, make sure that your list names and click-through-rates (CTRs) are showing up correctly. If you commonly see CTRs over 100%, you may not be recording view_item_list events correctly.
Are you using item promotions?
If you are using the view_promotion event, you should see data in this table. Promotion events are typically recorded at the same time as a page view, so if you aren’t seeing them show up, you likely have a configuration issue and will need to check your coding or check with your shopping cart provider.
Is your product data correct?
This table contains all your product-level data that GA4 has recorded. We recommend looking for these issues:
- Item Name: Item names should be correct and match what you’ve set in your shopping cart software.
- Item Category: Items should be in the correct category.
- Items Viewed: Look for values of 0 but add to cart or purchase numbers greater than 0. This means that your view_item event is not recording correctly.
- Items Added to Cart: Look for values of 0 but purchase numbers greater than 0. This means that your add_to_cart event is not recording correctly.
- Items Checked Out & Items Purchased: These numbers may not match (unless you only sell a few things) as they are measuring two different aspects of the purchase. Items Checked Out is the number of items that were in the cart during checkout, and Items Purchased is the number of this specific item that was purchased.
- Item Revenue: The revenue for this item. Remember our important note regarding revenue earlier, if you transact in a currency other than USD.
- Cart-to-View Rate: The number of users who added this item to their cart, divided by the number of users who viewed the item in total. Note the important point that it is recording users, not views in general. For example, if an item is viewed 5 times by one user and 5 times by another user, and one user adds the item to their cart, the Cart-to-View Rate will be 50%, not 10%.
- Purchase-to-View Rate: The number of users who purchased this item, divided by the number of users who viewed that item in total. Similar to Cart-to-View Rate, remember that this is based on users, not views.
Next Steps
We wanted this dashboard to be as useful to as many people as possible, which is why we didn’t include any custom dimensions or custom metrics. If you do have custom dimensions or custom metrics that you want to also evaluate, feel free to make a copy of this dashboard and modify it.
Copy the GA4 Audit Dashboard
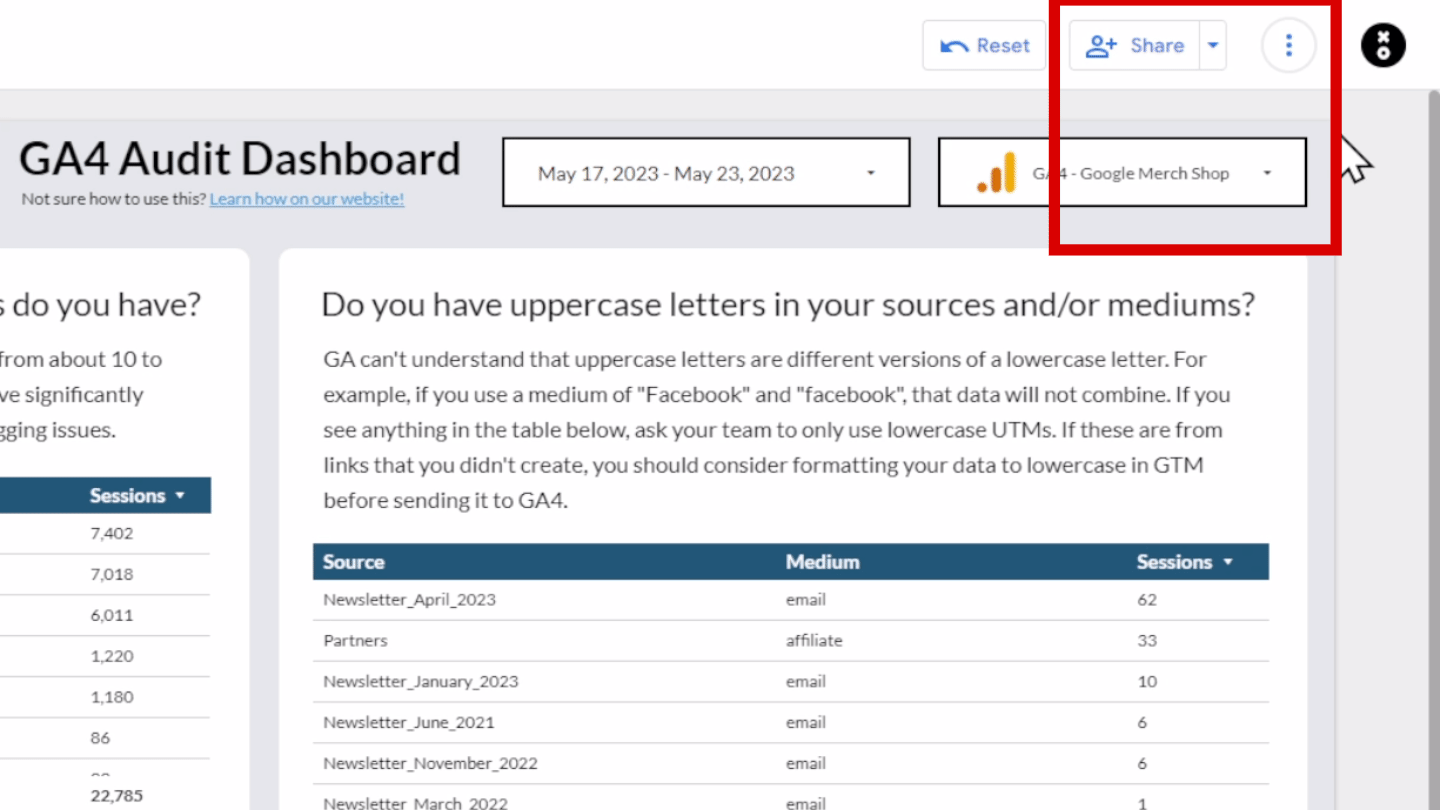
You don’t need to make a copy to use the dashboard, but if you want to make changes, you’ll need to create your own copy. To make a copy:
- At the top right of the dashboard, click the three dots (More options)
- Select Make a copy
If you have further questions or ideas on what you’d like to see included in this dashboard, please get in touch! And if you want to learn more about GA4, check out our free GA4 course on YouTube, or join the waitlist for our Analytics for Agencies course.
Take Our Analytics for Agencies Course

Dana enjoys solving problems that haven’t been solved before. With her 20+ years experience in digital marketing and teaching, she has a knack for distilling complex topics into engaging and easy to understand instruction. You’ll find Dana sharing her knowledge at digital marketing conferences around the world, teaching courses, and hosting a technology column.
Learn more about Dana