Creating content is easy. Figuring out if that content is actually successful or not is hard.
Measuring content success is something many marketers struggle with because how else can you measure success beyond a page view metric? Don’t page views tell us everything we need to know about how content is performing?
Unfortunately, page views only tell a fraction of the story.
You may think that a page view means that someone came to your website and viewed that page—and of course you would, it’s right there in the name! But what does “viewed” actually mean?
A view could be:
- A visitor reading your blog post in full.
- An accidental tap on a display ad where the visitor didn’t tap the back button fast enough.
- A tab left open for weeks but never actually visited.
- Clicking the wrong search result and starting to read the page before the visitor realizes their mistake and clicks the back button.
- A tab left open and visited every day to see if new information was posted.
- A visitor coming back to the same page several times in the same day, as they think about what product to buy.
Technically those are all page views. Should they all count? Not necessarily. But if you’re looking at page views in a tool like Google Analytics, they all count equally.
When page views are used as a metric to determine success, the focus can easily turn to quantity over quality. We can do better! We can change our approach to content success.
How does Google Analytics define a page view?
Google Analytics documentation defines a page view as a page (or screen, if you’re recording mobile app activity) that is loaded or reloaded. That metric, on its own, isn’t necessarily telling you if your content is helping you accomplish your goals. In the past, Google Analytics would even report visitors as “bounced visits” if they spent a long time reading your content, but never went to a second page of your site.
Things are slightly better in the new version of Google Analytics—GA4. There is a new metric in GA4 called “engaged sessions” where a session becomes engaged when:
- More than 10 seconds have passed since the session started (e.g. the visitor has your page open for 11 seconds), or
- Two or more pages were visited, or
- A conversion event occurred.
The 10 second trigger for an engaged session is very short and you may want to increase it, depending on your website and goals. You can change this under Data Streams > (Your Web Stream) > More Tagging Settings > Adjust Session Timeout.
Even with an interesting new metric like engaged sessions, GA4 can’t analyze and interpret whether or not these engaged sessions include the kind of page views that you want. To do this, you can use Google Tag Manager to enhance the information that GA4 is collecting when visitors come to your website by identifying and accounting for various visitor behaviours—especially when it comes to your content.
Want a better relationship with your data?
How can you measure content success?
What counts as content success for you (or your clients) will vary depending on your goals. If you have already created a goal charter, you’re part of the way there! There isn’t a one-size-fits-all approach to measuring content success because every type of business and organization will have different goals for their content and different strategies and tactics that they’re employing to reach those goals.
Even different pages on the same website may have different measures of success.
We’ve covered four different options you can implement to enhance your content analytics or build a content marketing measurement framework. You might end up implementing all of them or just some—that’s up to you and your content goals.
1. Understand browsing behaviour
In a perfect world, every website visitor would follow perfectly attributed links to your website and complete exactly the action that you wanted them to take in a short enough time frame that their session wouldn’t time out.
Instead, here are some things that actually happen:
- Visitors open other pages on your site in new tabs
- Tabs are kept open for days, weeks, and months
- Back buttons and forward buttons are used to navigate the site, instead of on-site links
These kinds of behaviours aren’t captured in a default Google Analytics implementation because of how web browsers work. Your browsing behaviour is recorded on the current tab that you’re using, and the analytics script can’t “see” that you ended up opening a second page in a new tab but haven’t looked at it yet, or that you reloaded the current page. All analytics sees is another page view—it doesn’t understand the context behind what happened.
All this information is actually accessible in the browser that your visitor is using, and by adding custom HTML via Google Tag Manager, we’re able to capture this information and save it, along with any page view that’s sent off to Google Analytics.
What can you learn by tracking browsing behaviour
When you track browser behaviour, you can find out if your visitors are opening your pages in a new tab, if they use back/forward buttons to get around, or most importantly—if they’re hoarding your website tabs in their browser for weeks and months.
Tab hoarding isn’t necessarily a bad thing! It could indicate that you have a really interesting or useful page that they want to visit often, or definitely want to come back to later. But if you count all those hoarded tab page views in with your other page views, you aren’t getting a complete picture of how visitors are engaging with your website. This is particularly important if getting new visitors is a goal for your website—people who are tab hoarding definitely aren’t new.
Using Google Tag Manager to capture browsing behaviour
This solution was first put together in 2018 by Simo Ahava and Jethro Nederhof, and you can find the full technical details on Simo’s website. You can follow the steps on his website to set this up, or you can download our pre-built Google Tag Manager container that has all the tags and variables that you need for a GA4 implementation.
You’ll notice in our container that we have a separate page_view tag instead of using the built-in option on the GA4 configuration tag. If you select the option to have the page_view sent from the configuration tag, you can’t modify the parameters with every page_view event—which means that you won’t get the data that you need. You must have a separate page_view tag for this data to populate correctly.
Viewing browsing behaviour data in GA4
Next, add the parameters from the page_view event as custom dimensions or custom metrics (depending on the type of parameter) in GA4. For example, add the nav_action parameter as a custom dimension, and nav_tabcount as a custom metric.
Adding these means that you will be able to see this data in GA4, but the best way to view this information is in Google Data Studio.
How to identify tab hoarders
Here is an example table of the data that you could get by tracking browser behaviour (this is from our own website):
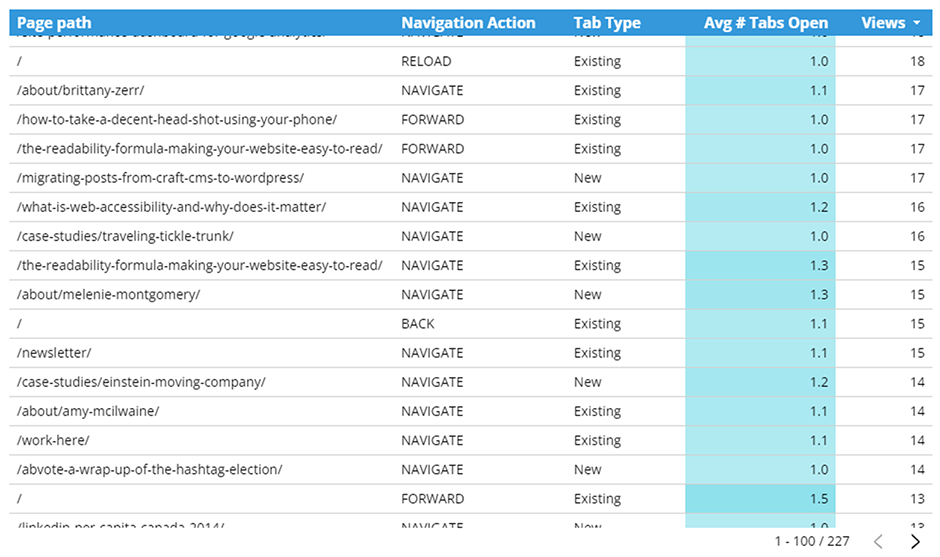
The Navigation Action column tells us how the visitor loaded this page—navigate means that they clicked a link or typed in the URL directly, reload means that the page was reloaded, and back/forward means that the visitor used those buttons to view the page.
The Tab Type tells us what type of tab the page was loaded in—new is a new tab, existing is an existing tab.
If a visitor has viewed the page with a reload navigation action and an existing tab type, that likely means that the tab is hoarded.
How many tab hoarders do you have?
Once we know who is a tab hoarder, we can see what percentage of the overall page views include tab hoarding. Here’s an example of aggregated tab hoarder data for one of our clients.
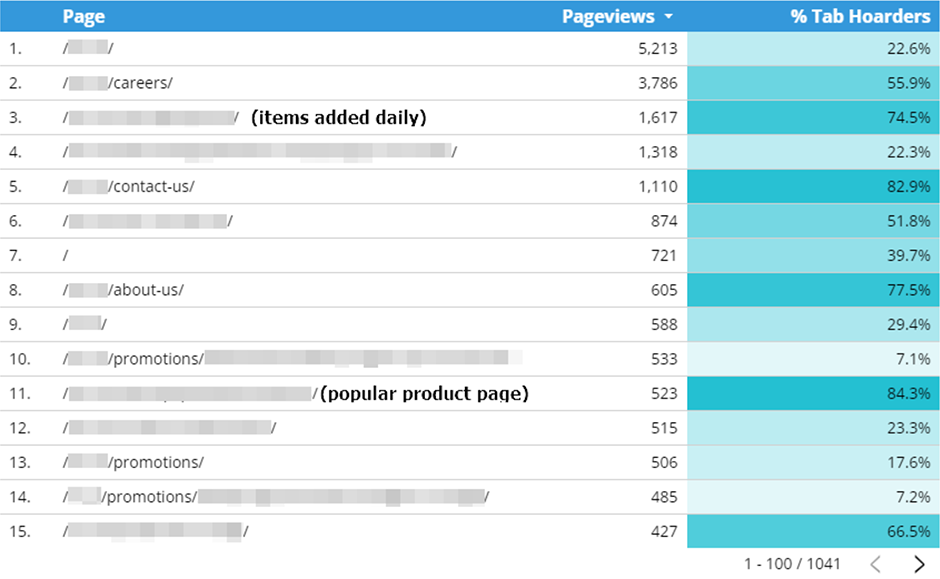
This level of hoarding seems high, but it makes sense based on what types of pages this client has. Of course visitors would keep the page where items are added daily open all the time. But it does mean that if increasing new visitors is a goal for this client, we can safely say that 74% of those page views are from existing visitors, not new ones.
2. Capture the long-term popularity of content
Most reports are set for a specific time period—for example, last week or last month—not the whole time your website has been around. That’s fine for some data, but if you want to understand which pages on your website are consistently bringing in the most traffic, you need to broaden your reporting time frame. However, just changing your reporting time frame to be “since your website was published” until today won’t give you what you need. Some pages were likely published on different dates and you need to take that time period into account as well.
What you need to do is capture how long each page has been around and then normalize the views across those different time scales so that every page’s views can be judged on a level playing field. Then you can make a call on which pages are most effective at bringing in new visitors.
How to measure long-term content performance
Step 1: Find out the publish date for each page
You may be able to figure out when a page was published by capturing on-page information.
For example, if your site is on WordPress and using the Yoast plugin, you will have meta data that looks like this and contains a published_time:
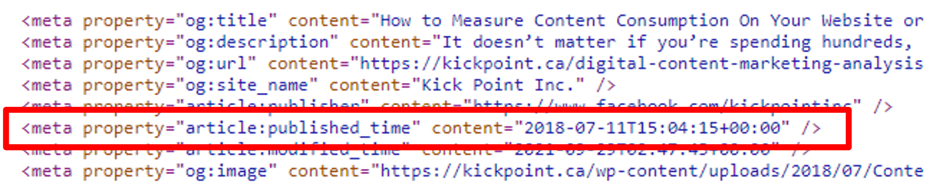
You can capture this data by adding a Custom JavaScript variable in Google Tag Manager with this code:
function (){
var metaName = "article:published_time";
var metas = document.getElementsByTagName('meta');
var content = undefined;

for (i = 0; i < metas.length; i++){
if (metas[i].getAttribute("property") == metaName){
content = metas[i].getAttribute("content");
}
}
return content;
}
If you aren’t using WordPress, you may still have the published date accessible to you. For example, this is how the published date would appear in NewsArticle schema:
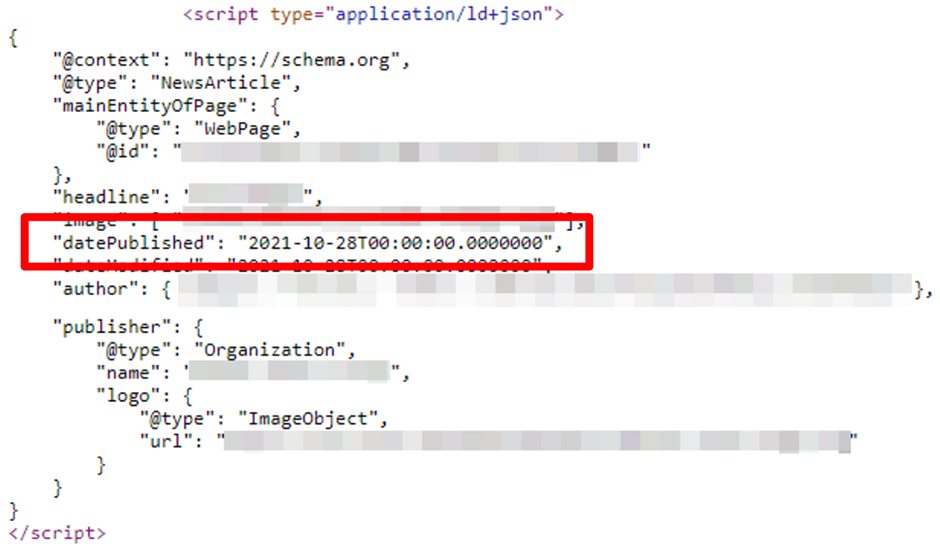
To capture the datePublished information, use this code in a Custom JavaScript variable in Google Tag Manager:
function() {
var ldjson = document.querySelector('[type="application/ld+json"]');
var json = JSON.parse(!!ldjson ? ldjson.innerHTML : '{}');
return json.datePublished;
}
Then, add this variable as a parameter on your GA4 page_view event in Google Tag Manager.
If the publish date isn’t accessible through these methods, you may need to turn to your RSS feed (if you have one) or scrape the page itself for publish dates.
Step 2: Create custom fields in Looker Studio (formerly Google Data Studio)
The actual calculation of how many days your page has existed is done in Looker Studio. Once you’ve added your GA4 property as a data source, create a custom field. You’ll use the DATE_DIFF function for this calculation:
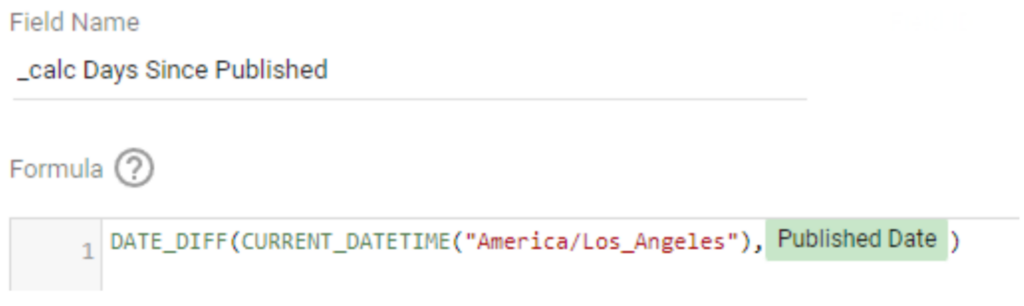
Make sure to set the time zone to be the same as the time zone in your GA4 Property Settings.
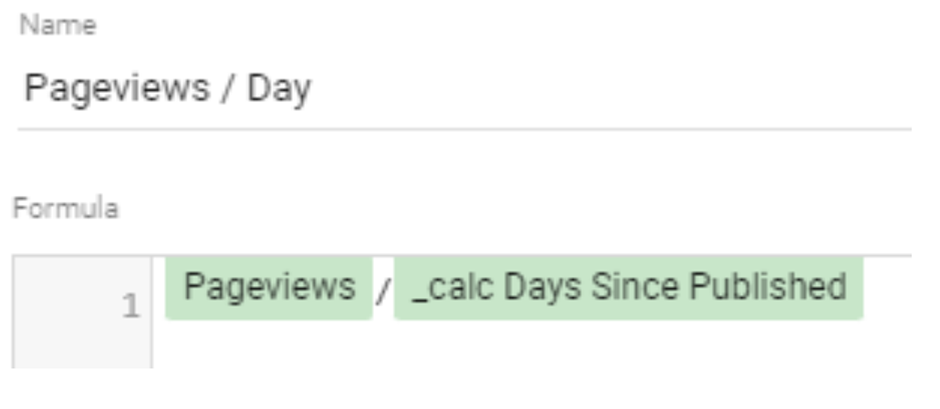
Then, create a second custom field that calculates the number of days that the page has existed with a simple math calculation:
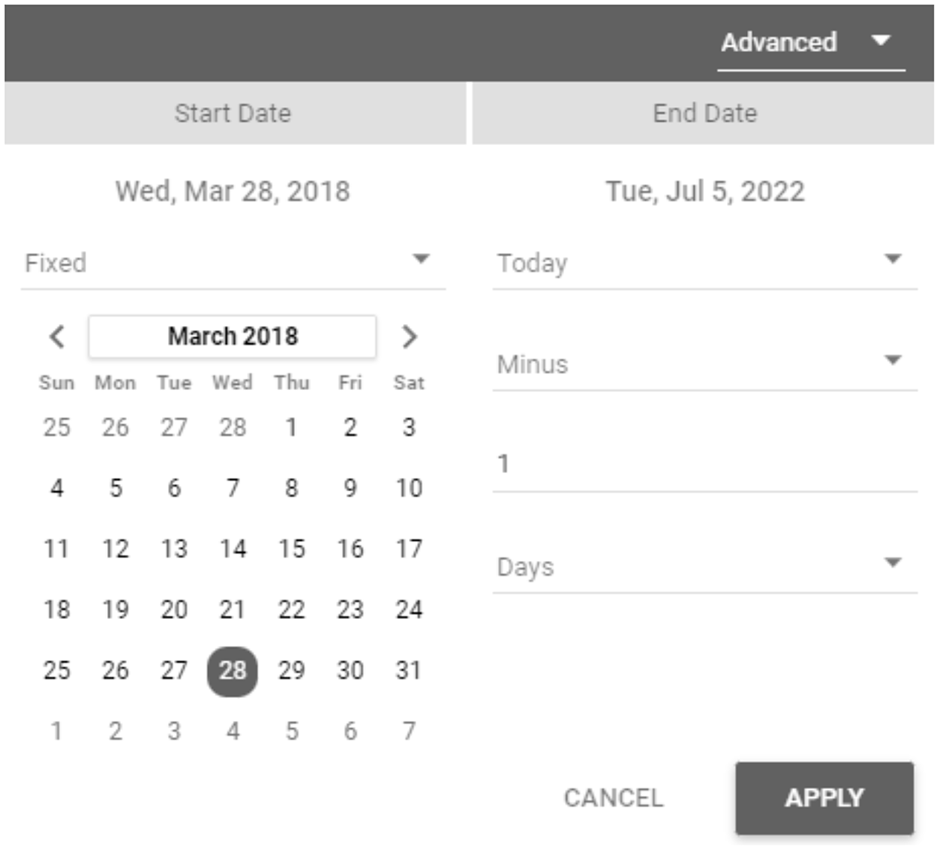
Step 3: Create the analysis in Looker Studio
Set the time period in Looker Studio using the Advanced option where the Start Date is the day the very first page was published, and then set the End Date as today minus one day. This way the analysis is always up to date with the most recent information.
Then, create a table with these columns:
- Page – URL of the content,
- Views – all views of this page, and
- Pageviews/Day – the average number of views per day since that page was published.
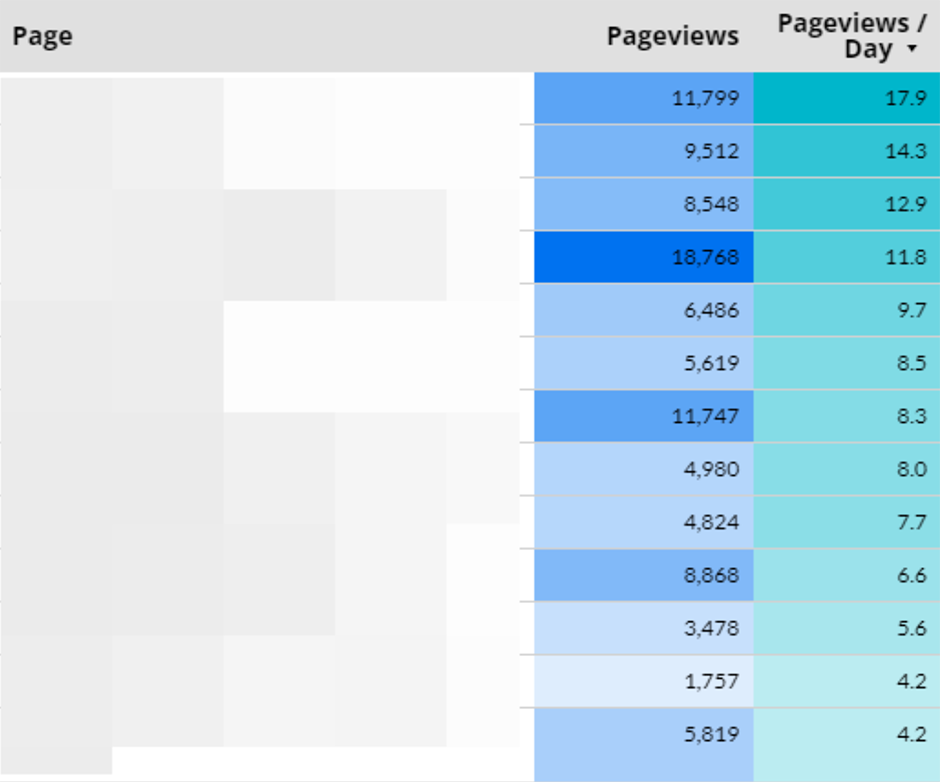
We recommend using the heatmap option for the metrics as that makes it really obvious where there are mismatches between the total pageviews and the pageviews per day. For example, the 4th row in the example above has a lot of views, but on a pageviews per day scale it isn’t as great as the first three rows.
Now you can analyze and compare your content on the same time scale and get a better understanding of which pages are bringing in the most traffic. Now, ask yourself—are those pages converting? If a page isn’t performing well, what can you do to improve the content? Can you establish a goal pageviews per day and then see early on if your new content is hitting that goal?
This example we’ve given you is just the start—try adding more metrics and dimensions such as source and conversion rate to gain an even deeper understanding of how your content is performing in the long term.
Become an analytics pro
3. Was your content actually read?
Knowing that someone visited your page is one good—knowing if they actually read what you had to say is better. Measuring content consumption will tell you whether or not your visitors are actually reading your content.
Our content consumption code measures how long it would take someone to read the content on the page, then sees if that person stayed long enough on the page to read that content. Then, combined with whether or not they actually saw the entire piece of content, we can tell if that content was consumed or not.
We have a step-by-step on how to measure content consumption, with a new WordPress plugin and a Google Tag Manager recipe.
4. Determine if the conversion was even possible
Conversion rate is a common metric in reports—after all, without conversions, how do we know if our marketing is working? Conversion rate measures whether or not a visitor converted, but what conversion rate doesn’t measure is whether or not the visitor could convert.
The conversion rate is always 0% if the visitor can’t see a path to conversion.
Did your visitor see the form? Did they get to the purchase button? Did they see the sign up link? If they didn’t see it, how could you expect them to convert? Knowing if someone could actually convert or not, should change how you report on conversions.
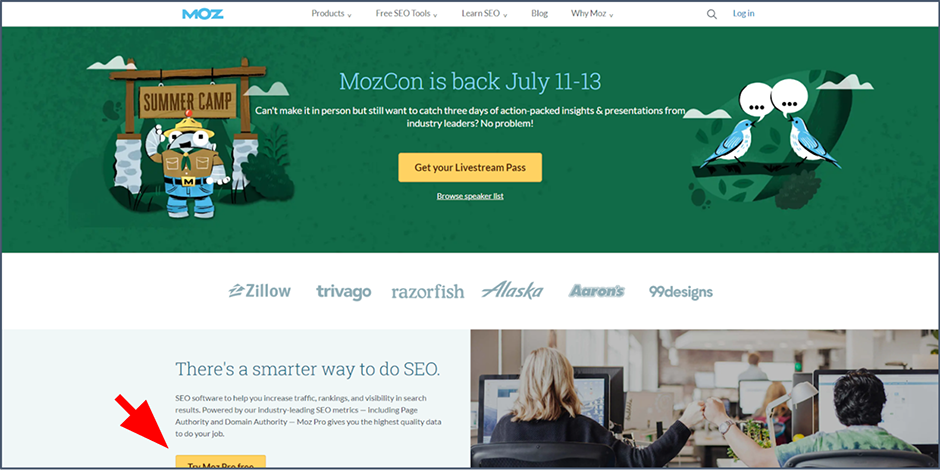
Here’s an example, the Moz home page. This screenshot was taken on a big desktop monitor and you can see their CTA, “Try Moz Pro Free”, peeking out at the bottom.
Now let’s look at their home page on a mobile device. That CTA is nowhere to be found when the page first loads, but once you scroll down a bit, it shows up.
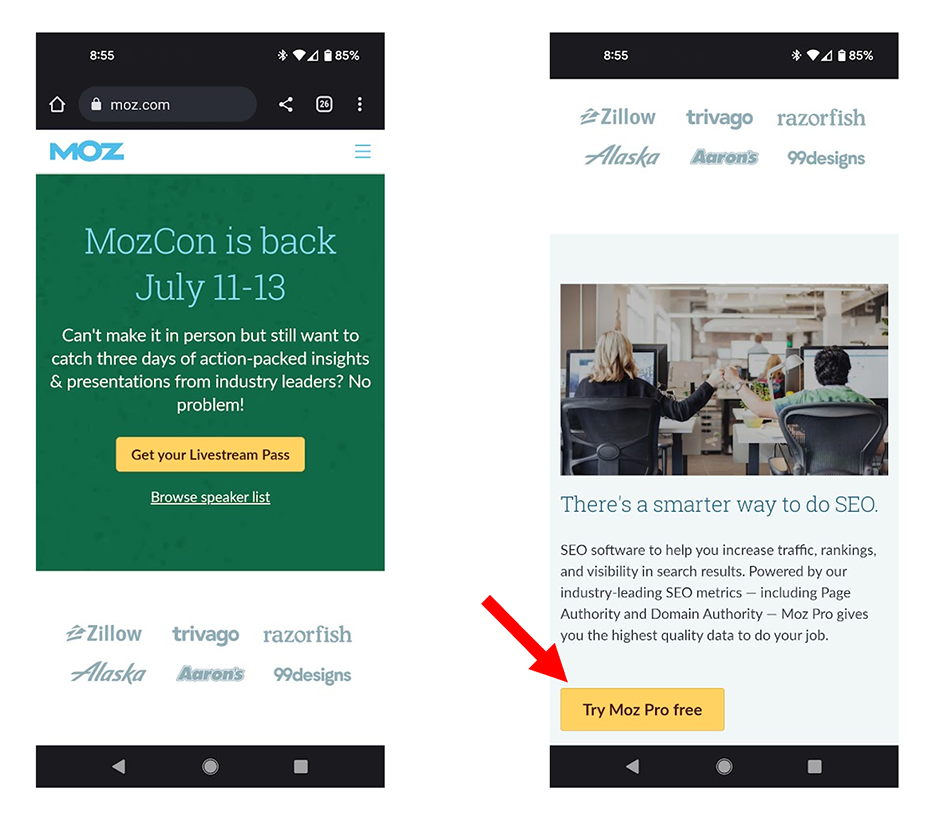
Now you could safely assume that the visitor could convert since that button is there, telling them what to do. But how many people actually scroll down far enough to see that button?
Recording when a call-to-action (CTA) is shown
We can use Google Tag Manager to “listen” for specific CTAs and then record events when they are shown to visitors.
First, we need to determine what’s unique, code-wise, about the CTA that you want to track. Does the CTA have a unique CSS ID or class that we could use? Does it link to a specific URL? If you’re unfamiliar with how to find a CSS class or ID selector, this post can help.
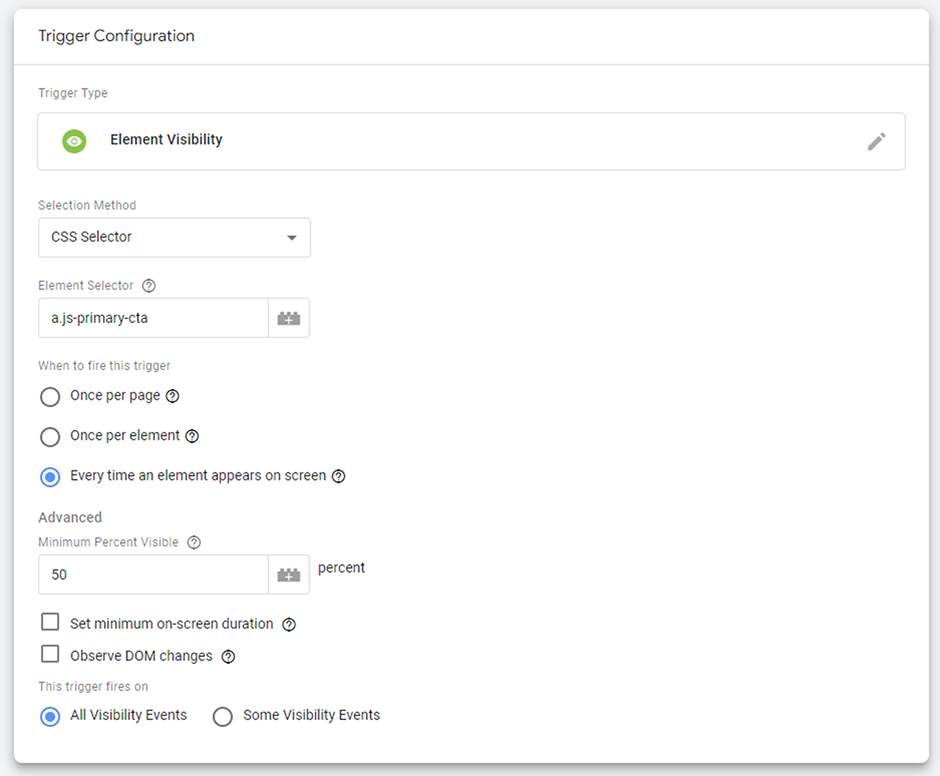
In this example, the Moz button has a class that includes “js-primary-cta”, so that is the class that we’re going to ask Google Tag Manager to track. This is what that would look like, using the Element Visibility trigger:
But every CTA button on the Moz site uses this same class—what if we only want to track CTAs for the Moz Pro trial? The Moz Pro trial page lives at https://moz.com/checkout/freetrial, which means that we can add a condition to the trigger and ask it to listen for views of the button, but only buttons that lead to that URL specifically:
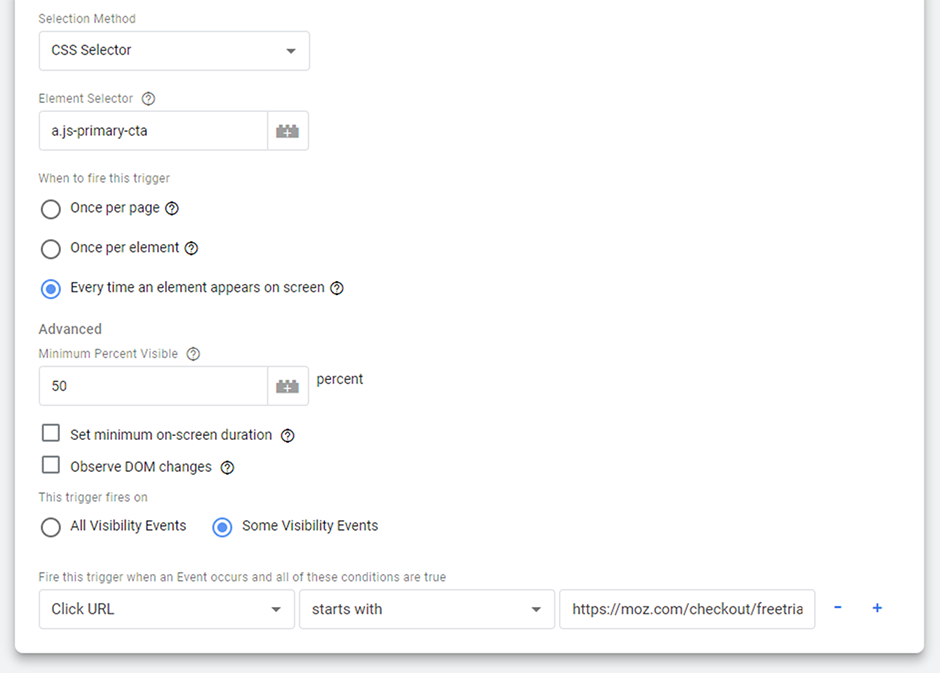
Even though the condition uses the “Click URL” variable—the name is a bit misleading. You don’t need someone to click the link in order for the Click URL to be read, this records where a link goes, not necessarily if a click was clicked or not.
Why shouldn’t we use the button text to track buttons? Click text can absolutely be used as well—but then you need to be sure that the text never, ever changes. If you ever change the button text, even through using A/B testing software, you’d end up missing out on visibility events!
Once you have recorded this visibility event, use it to calculate conversion rate instead of using the default conversion rate metric:
View to Conversion Rate = (Conversions / CTA Views) * 100
How does CTA visibility impact conversion rate?
Knowing when the CTA is visible or not turns conversion rate from a one-size-fits-all measurement into a funnel measurement.
Here’s a typical conversion rate when we aren’t taking CTA views into consideration:
- 1000 visits
- 10 conversions
- 1% conversion rate
And here is the conversion rate when we are taking CTA views into consideration:
- 1000 visits
- 250 CTA views (25% CTA view rate)
- 100 conversions
- 40% view to conversion rate
Not only do you now have a much more accurate conversion rate since it reflects the number of visitors who could actually convert, you also know that more visitors need to see this CTA.
How to include content success metrics in a report or dashboard
Using “Jobs to be Done” to improve your reporting
Jobs to be Done describes what a given visitor is trying to accomplish—for example, a job to be done would be a purchase, or learning more about a topic, or contacting you. Different pages on your website have different jobs, but yet in our reporting, we tend to show all the pages regardless of their jobs.
Not every page on your website has the same job, and therefore shouldn’t be measured against the same metrics.
Instead, we should change our reports so that (for example) we’re only showing the pages that have a goal of conversion in the conversion report, or the content consumption pages in the content consumption report. By limiting which pages we include based on what we’re reporting on, we’re able to keep the report focused and relevant for those who are using this report to draw insights and make changes.
How to assign a job to be done to pages on your website
You can add a job to be done to each page on your website in a few different ways:
1. Use a meta tag
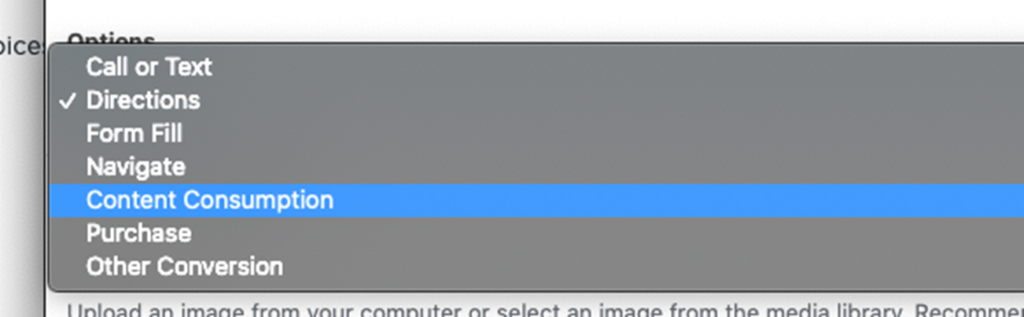
This is a method that we have started using in the WordPress websites that we build. First, every page and post has a drop down with a list of all the possible jobs that could be done on this website. For example:
Then, the selected option is included in the meta data for that page, like so:
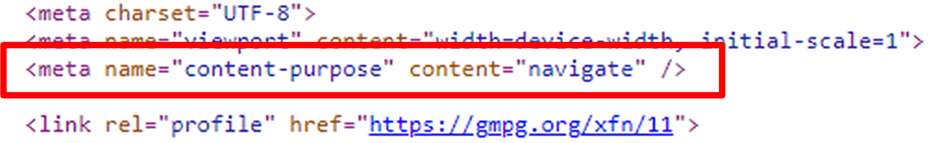
Using a variable in Google Tag Manager, we capture the value of this meta tag and save it along with every page view, similar to what we did in the “How to measure long-term content performance” section.
2. Create a spreadsheet
If a meta tag is out of reach, or if you have a small site, a spreadsheet might be the simplest way to create this, like so:
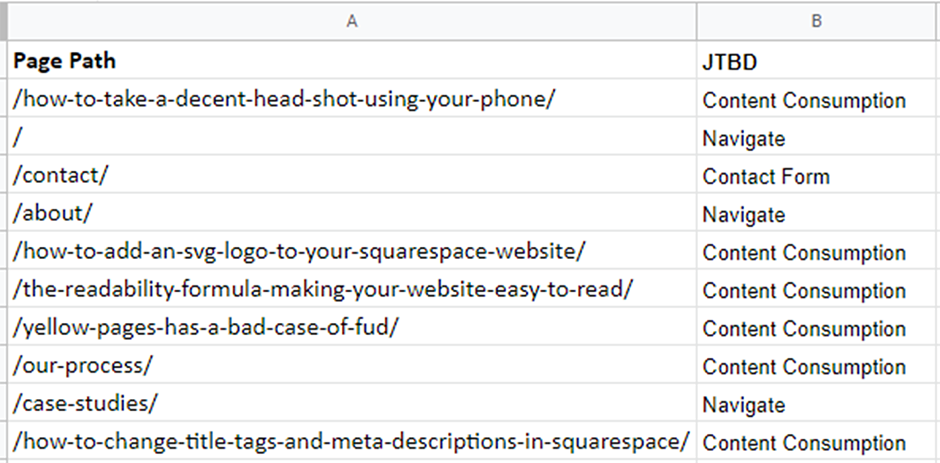
Instead of saving this data in GA4 directly, we recommend making a blended data source in Google Data Studio to filter for the pages that are shown in your charts.
3. Use the page template or page URL
Your page template or URL can also give you hints on what job should be done for that page. For example, you can likely assume that blog posts have a job of content consumption and pages with /product/ in their URL have a job of “add to cart”. You could use a Lookup Table variable in Google Tag Manager to assign a page purpose based on a specific class found in the tag, or based on URL path. Our post on content consumption has more details on how to use Lookup Table variables if you’re unfamiliar with them.
Why you should filter the pages shown in your reports based on the job to be done
Every chart on your report should answer a question, and your report becomes less actionable when you include pages in that chart that aren’t relevant to that question. If there is a page on your site that can only be viewed after people sign up for your service, why would you include that page in a chart outlining your sign up conversion rates?
Ignoring what doesn’t help you is just as important as paying attention to what does help you.
Keep this in mind every time you look at your data or create a report—how much noise are you introducing? By reducing the amount of irrelevant data in your reports, you can stay laser focused and enact change on what does matter.
Ready to create reports that actually track what matters?

Dana enjoys solving problems that haven’t been solved before. With her 20+ years experience in digital marketing and teaching, she has a knack for distilling complex topics into engaging and easy to understand instruction. You’ll find Dana sharing her knowledge at digital marketing conferences around the world, teaching courses, and hosting a technology column.
Learn more about Dana