Whether you’re a seasoned marketer or just starting out, navigating the complexities of tools like Google Analytics 4 and Google Tag Manager can be overwhelming. From struggling with setup and configuration to deciphering reports and data, these challenges can hinder your ability to make data-driven decisions.
This is why we opened up the floor to your most pressing analytics questions. Dana covered everything from GA4 to GTM, ads, and Looker Studio, providing practical solutions to common pain points.
If you missed the live webinar, watch the full recording below and catch up on all the valuable insights with a recap of all the questions.
Engagement Rate
Can engagement rate be applied to a page?
A commonly misunderstood part of GA4 is the idea of scopes—dimensions and metrics have different scopes which means that they can only be applied to certain types of data.
There are 4 scopes in GA4:
- User
- Session
- Event
- Item
A common mistake users make is misapplying session-scoped metrics, like engagement rate, to event-scoped dimensions, such as individual page views. This mismatch results in reports showing inaccurate data, often displaying the metric average as zero.
To avoid this, ensure that the dimension has the highest scope and that the metrics attached are appropriate for that scope. For instance,
- Session-scoped metrics should be used with session-scoped dimensions (like landing pages),
- Event-scoped metrics should be used with event-scoped dimensions (like page views).
🔖 This GA4 cheatsheet has a list of all the scopes of all the dimensions and metrics in GA4—bookmark it!
Standard reports vs. Exploration reports
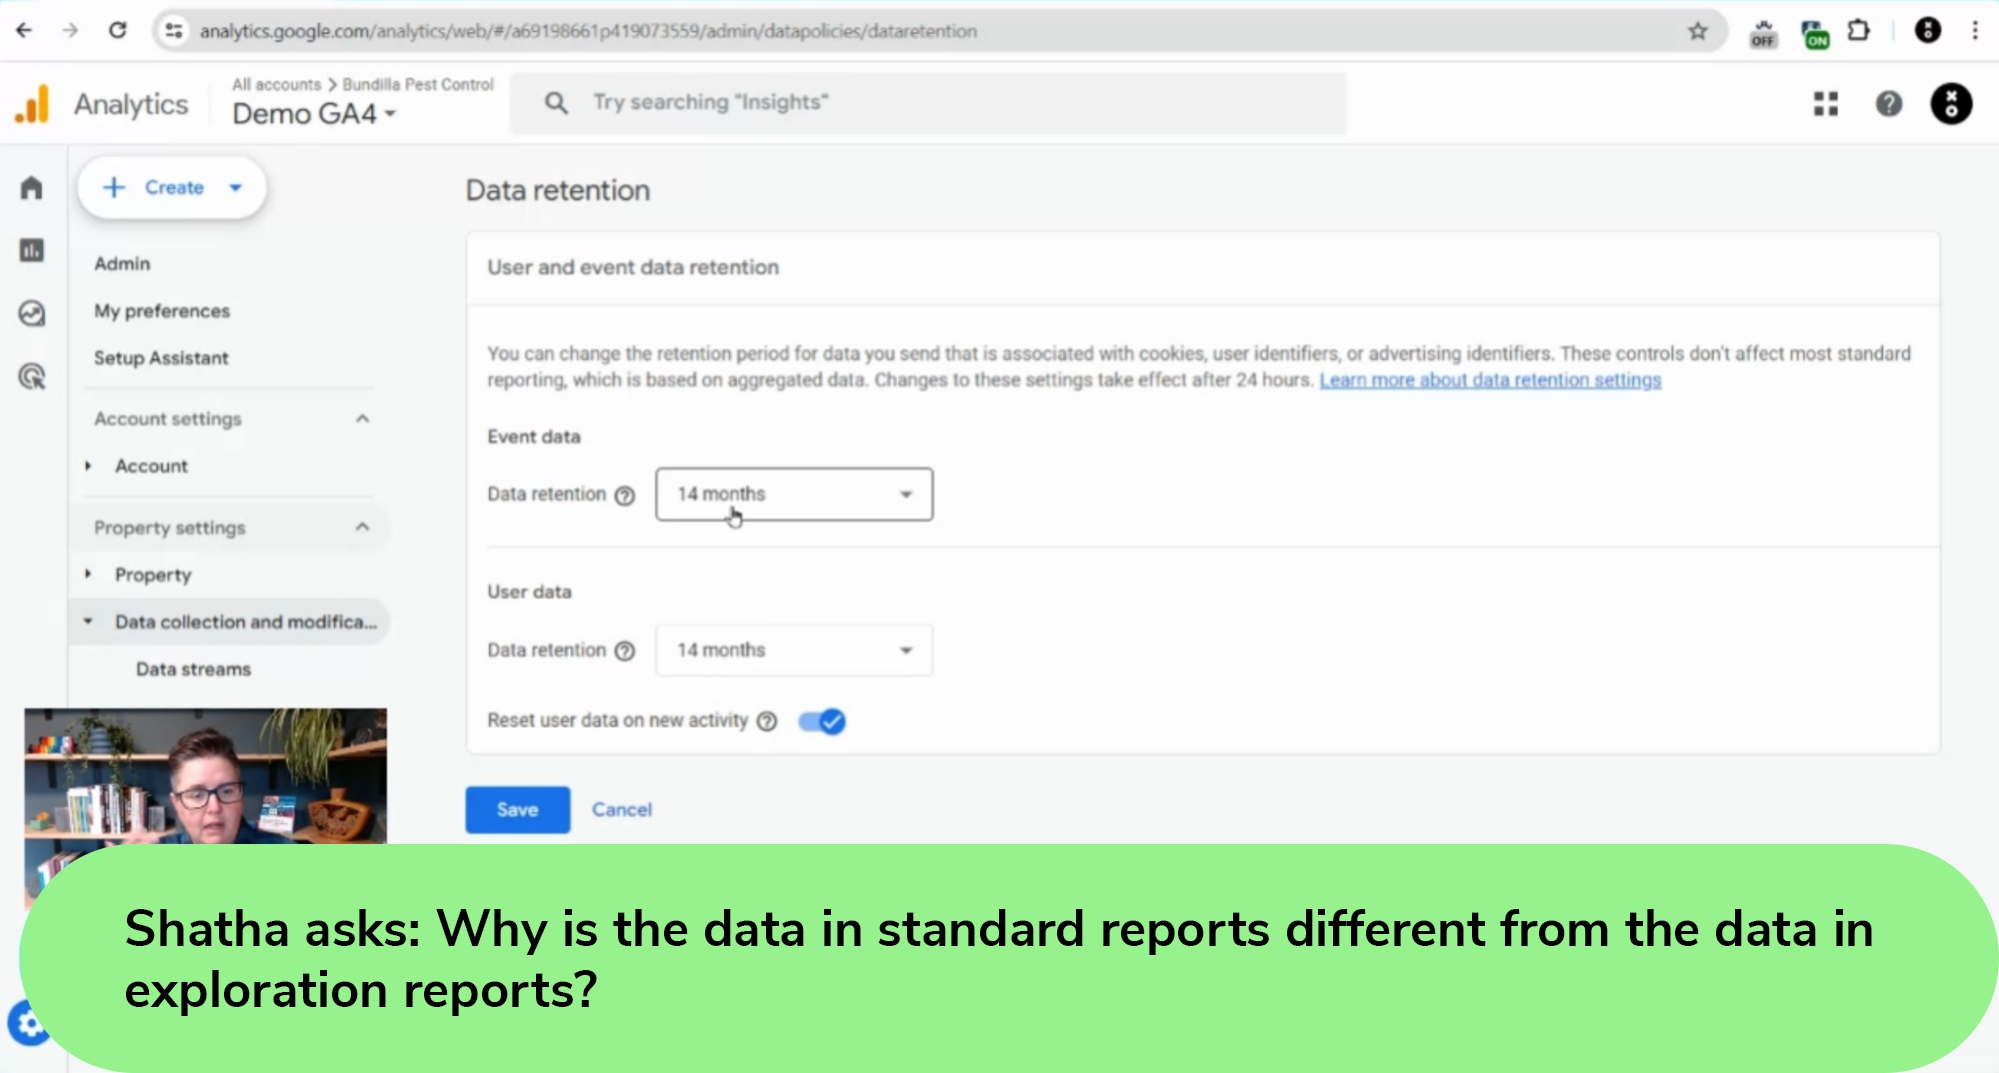
Why is the data in the standard reports different from the data in the exploration reports?
There are a few possible reasons:
- Data in the Reports part of GA4 may be aggregated differently than what you see in Explorations.
- The data retention settings in GA4 affect what you see in Explorations. By default, data retention is set to two months, limiting the historical data accessible in exploration reports. To extend the retention period to 14 months:
- Navigate to the “Admin” section in GA4.
- Locate the “Data Retention” settings.
- Extend the retention period
- The filter options are more robust in Explorations than they are in Reports.
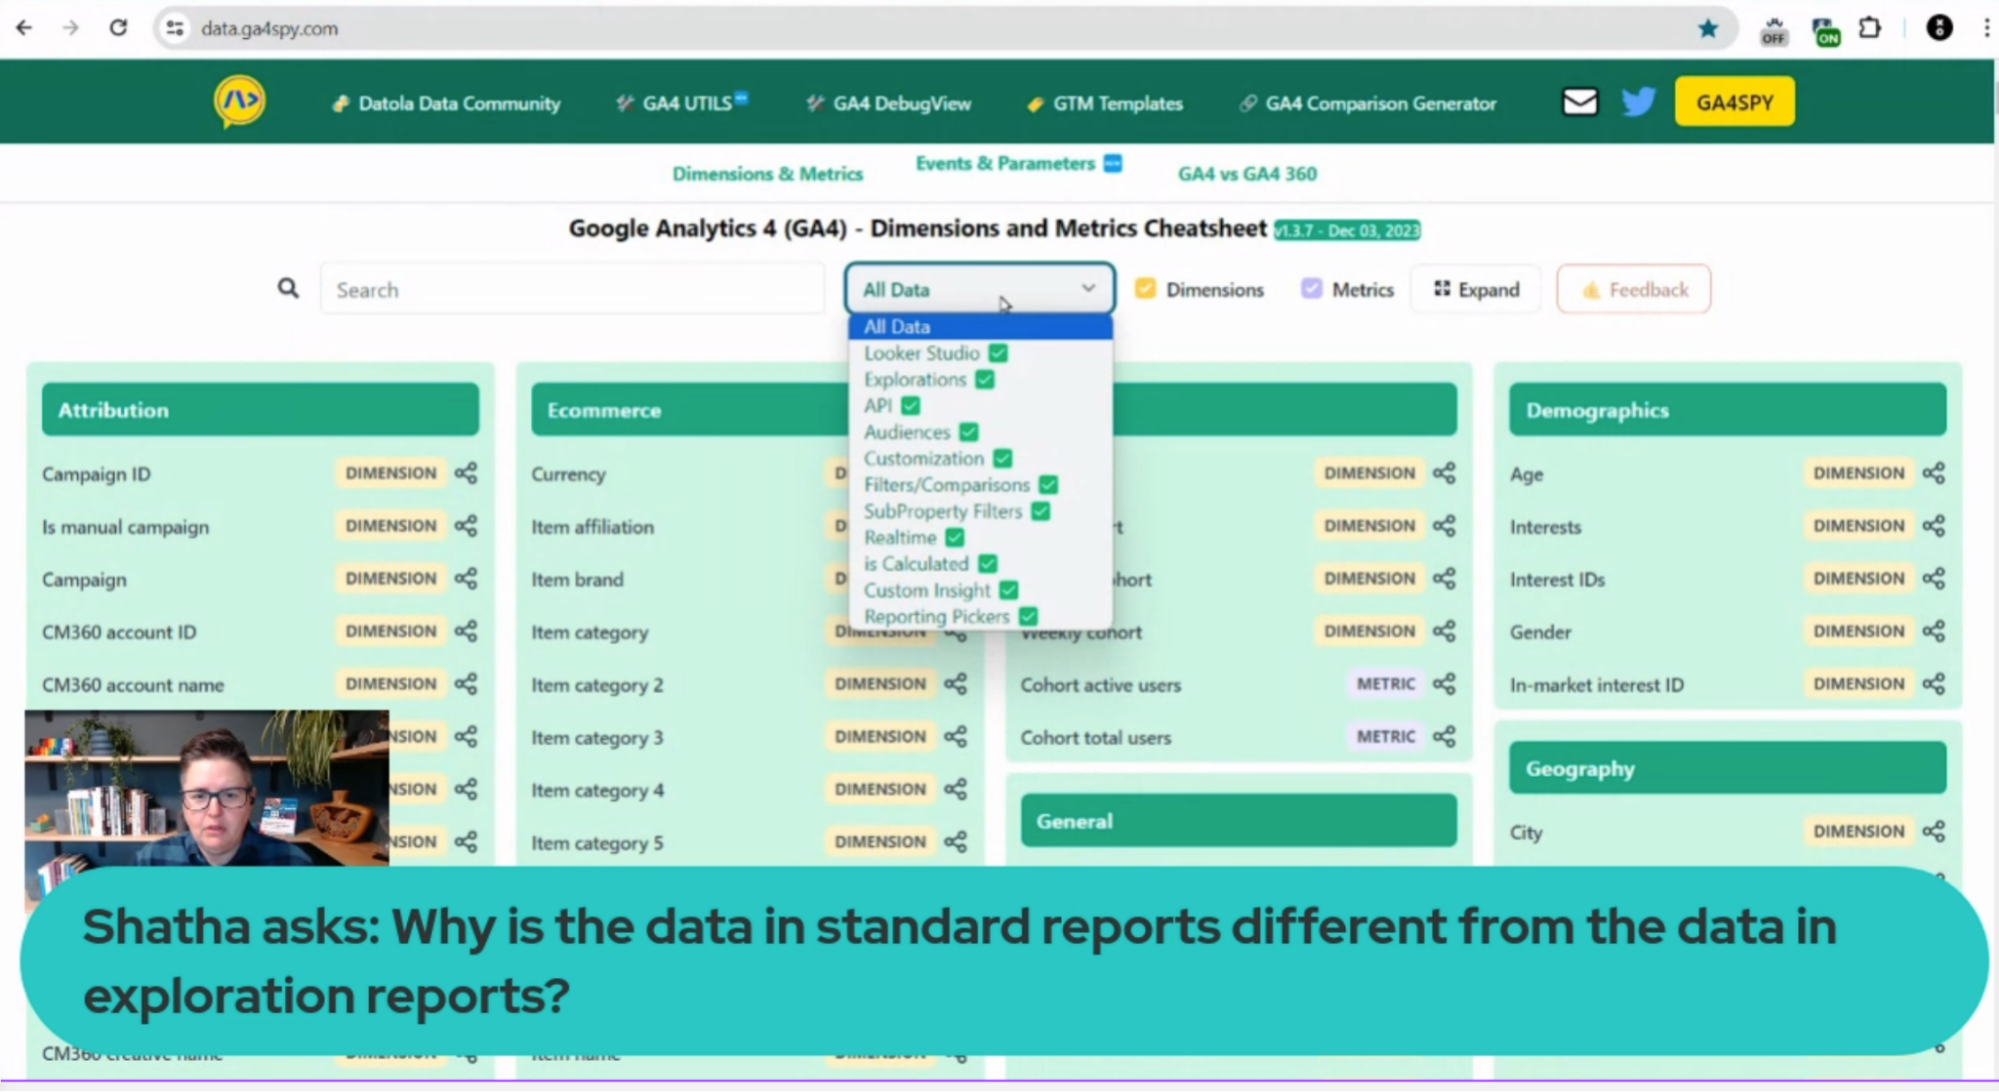
To see which metrics and dimensions are available in GA4:
- Visit data.ga4spy.com.
- Use the dropdown menu to select either “Explorations” or “Reporting Pickers.”
- Choose “Explorations” to filter the available metrics and dimensions specifically for exploration reports.
For example, if you’re looking for the “Exits” metric, which is only available in explorations:
- Search for it on the website.
- Once found, you’ll see a list of checkboxes indicating where it’s available.
💡 Keep in mind that some metrics may only be accessible in Explorations or as custom insights, and not in other tools like GA4 features like Looker Studio, API, or BigQuery. Utilizing this resource can help you identify which metrics and dimensions are available in explorations and streamline your data analysis process.
Unlock the full potential of your GA4 data!
GA4 audits for e-commerce
What learning structure do you recommend for someone wanting to offer GA4 audits and implementation for e-commerce stores? What are the first steps?
The best way to learn GA4 is by working with GA4!
1. Get hands-on with GA4:
The first step is to dive into GA4 and familiarize yourself with its interface and functionality. Setting up a GA4 account is free, allowing you to experiment with its features. If you don’t have a website to integrate GA4 with, consider using Weebly, which offers GA4 integration without requiring a paid plan. Start by setting up GA4 for your own test website and explore its capabilities by conducting various tests and experiments.
2. Volunteer or work with charities:
To gain practical experience in e-commerce analytics, consider volunteering your time with charities that have e-commerce websites. By offering your expertise to organizations like these, you’ll have the opportunity to set up websites, assist with analytics, and gain valuable hands-on experience in the field of e-commerce analytics.
3. Utilize GA4 audit dashboard:
Our GA4 Audit Dashboard is a powerful tool designed to help you analyze and optimize e-commerce websites’ performance. Accessible through our website, this dashboard allows you to assess crucial metrics such as transaction accuracy, shopping funnel effectiveness, and referral issues. By using this resource and attaching it to the charity or test sites you’re working on, you’ll gain insights into data quality issues and learn how to address them effectively.
4. Customize and learn:
Feel free to make a copy of and customize the GA4 Audit Dashboard according to your specific needs and requirements. Whether you need to focus on additional metrics or delve deeper into specific aspects of e-commerce analytics, you can tailor the dashboard to suit your learning objectives. Making a copy of the dashboard and customizing it for your own experience will enhance your understanding of GA4 and e-commerce analytics.
Filtering reports by property name in Looker Studio and GA4
If we have many properties, is there a way to filter reports by property name and be able to see different metrics for each in Looker/GA4?
This depends on what you need to do:
If you want to show multiple properties in the same chart:
You will need to blend the data sources in GA4. By blending data, you can consolidate information from various sources and visualize them together. For example, if you wish to analyze sessions from multiple sites concurrently, data blending becomes essential.
But there is a limit to 5 data sources in a blend so that may not be enough for your needs. In Looker Studio, data blending allows you to merge and display multiple datasets, providing a comprehensive view of your analytics.
If your focus is on examining data from individual properties one at a time:
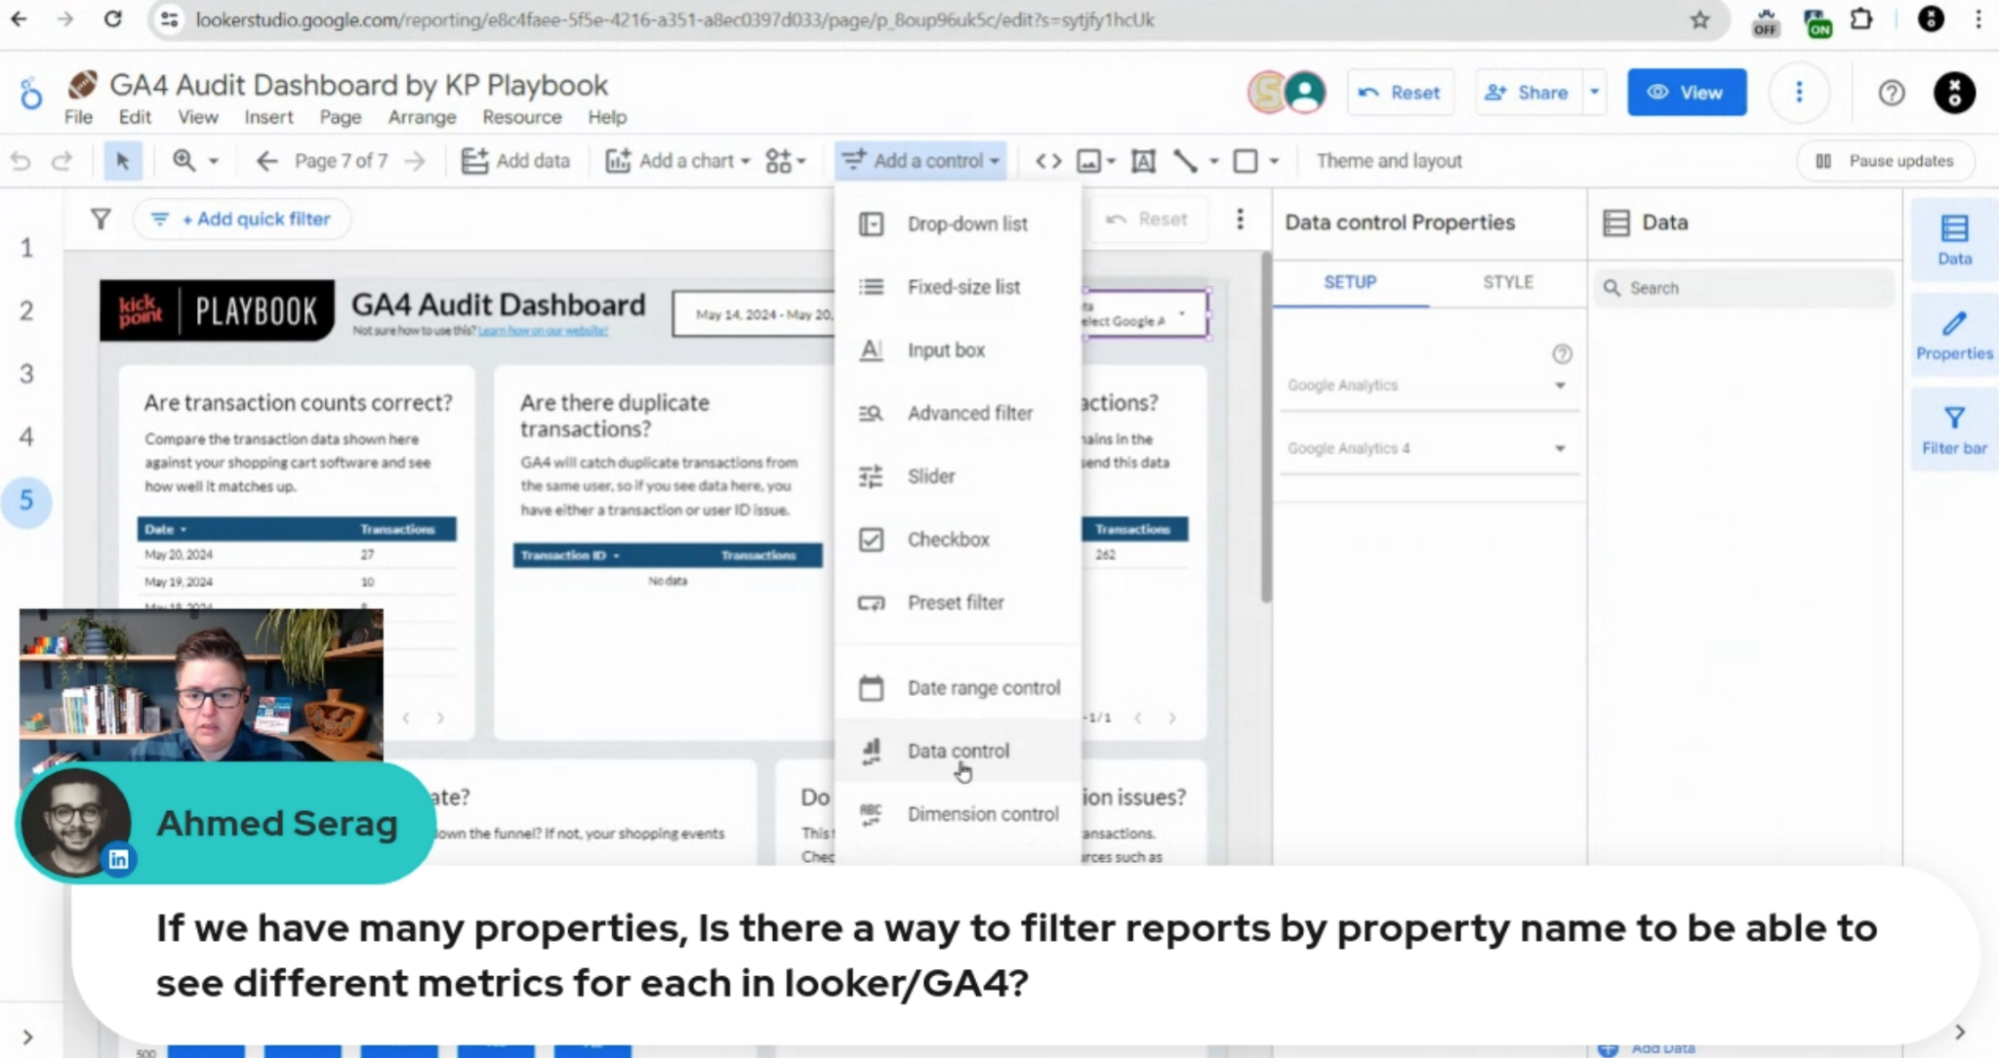
Looker Studio offers data controls. By adding a data control to your dashboard, you can easily switch between different GA4 properties and access their respective metrics. Here’s how:
- Navigate to “Add a Control”
- Select “Data Control”
- Choose the GA4 option
- Toggle between various properties within your dashboard.
This feature streamlines the process of analyzing different properties and their corresponding metrics within Looker Studio.
For a deeper understanding of how to set up reports and utilize different controls within Looker Studio, our GA4 Audit Dashboard serves as an invaluable resource. By examining the dashboard and its components, users can gain insights into report structuring and control implementation.
Feel free to explore the dashboard, make copies, and experiment with different settings to tailor it to your specific needs. Utilizing this dashboard can enhance your proficiency in navigating Looker Studio and extracting meaningful insights from your data.
💡 If you need a dashboard where you can change between different data sources, use the Data Control in Looker Studio.
Hosting provider and website builder for influencers
Which hosting provider and website builder would you recommend for someone who wants to set up a blogging website with future aspirations to become an influencer, attract analysts, and prove your reach to brands?
This depends on your level of comfort with code—if you don’t want to mess around with code, consider a website builder like Wix or Squarespace. I would say that Wix likely has the edge here when it comes to SEO-friendliness. If you do want to get in there and do some programming, you can look at WordPress (and our favourite WordPress host is WPEngine—that link gets you 4 months free!). However, the total cost of customizing WordPress plus hosting might be more than what you spend on Wix or Squarespace.
E-commerce platforms for Canadian websites
Which e-commerce options do you recommend for a website and business being planned in Canada?
Shopify, hands down. Not only are they a Canadian company but their platform is built specifically for e-commerce. However, if blogging or content is going to be an important part of your overall website strategy, Shopify isn’t as strong in that department, so you instead may want to go with a website builder like Wix or create a WordPress site with WooCommerce added on.
💡 Try out different platforms using their trial versions to see which best meets your needs, particularly in terms of SEO and content management.
Follow-up Question: Does Wix allow customization for infographics? I also want to earn from ads in the blog, so is Wix still the best option?
Yes, Wix allows for the customization of infographics as they can be embedded as images on the site. For monetization through ads, particularly with Google Display Network, it’s advisable to double-check compatibility, but generally, Wix supports various ad services. Wix remains a strong option for its ease of use and SEO capabilities, making it suitable for bloggers aiming to monetize their content.
Make reporting digestible for clients
How to translate detailed granular info into something digestible for clients to understand?
What a fantastic and difficult goal! The biggest thing to consider when it comes to working with clients is that they typically just want a single answer—are things going well? Are they seeing a return on their investment with you? And a 50-page novel isn’t going to answer that question. Here are some key things to focus on:
Focus on core messages
Clients typically seek straightforward answers rather than an overload of data. Start with concise reports, emphasizing key metrics and their implications. Utilize ample white space to avoid overwhelming the client visually and provide clear explanations for each element.
Use “microcopy”
We include what we call “microcopy” on all our reports so that someone doesn’t need to look at the report every day or every week to remember what all the different charts and tables mean. For instance, if presenting a GA4 audit dashboard, include notes explaining each metric and its relevance.
Inspire action
Every reporting element should lead to a specific action. Instead of showing a basic table of sessions by channel, highlight the impact, such as which channels are driving valuable traffic that leads to conversions. This approach helps clients see the value of the data and encourages them to take informed actions.
Use the client’s language
Reflect the client’s own words in your reports—if the client says “I want the phone to ring”, don’t report on phone call conversions, instead say “Here is how often your phone rang”.
Honesty and transparency
Always be truthful about campaign performance. If something isn’t working as expected, communicate it clearly and provide insights on possible improvements. Building trust through honesty is crucial, especially in an industry where barriers to entry are low, and clients may have had negative experiences with other agencies.
💡 For building strong client relationships, read The Speed of Trust by Stephen M.R. Covey and Selling the Invisible by Harry Beckwith.
Make reports your clients will actually read
BigQuery vs. third-party tools
BigQuery vs. third-party tools like Analytics Canvas: Which is better for generating queries and storing data?
Analytics Canvas is a great tool to work with BigQuery without actually having to learn Structured query language (SQL), but there is something to be said for having at least a base level of SQL knowledge if you are working in BigQuery. There are lots of great courses on LinkedIn Learning on BigQuery and SQL and if you don’t have a paid LinkedIn membership, many libraries have free access to LinkedIn Learning.
However, don’t feel that you absolutely must use BigQuery when it comes to GA4—it might be overkill for your or your client’s situation! That being said, we always recommend at least backing up your GA4 data to BigQuery, using the product connection in the GA4 admin. It costs pennies if you don’t access the data and then you have it if you need to access it in the future.
💡 While BigQuery is powerful, it’s not always necessary for every client. Use the right tool based on the client’s needs and your technical expertise.
Missing transactions in GA4 reports
Why are 40% of transactions missing in our GA4 reports despite successful implementation via GTM on our Magento e-commerce sites?
The immediate response when you say you’re missing 40% of transactions is that it is likely ad blockers as the latest surveys show that up to 50% of Americans do use an ad blocker. It’s entirely possible that the ad blocker is blocking GA4 but it isn’t blocking your Customer Data Platform (CDP) which is why you still see the data there. Also, if someone is refusing cookies, you can’t track them, so still expect to see less data in GA4 than what you’d see in Magento since you could say no to tracking but of course, your order would still show up in Magento.
What you could try is using PHP to serve an ad pixel to visitors and see if it’s rejected or not, and that would tell you if the user is using an ad blocker. But it’s likely an ad blocker or consent issue.
Additionally, check if the transaction drop is consistent across all browsers and operating systems. For example, if Safari shows more significant drops than Chrome, it could indicate a browser-specific issue.
Changes in Microsoft Ads conversion tracking
What are some of the major changes you’ve noticed in conversion tracking Microsoft ads in the last year since the GA4 transition, particularly for lead gen clients? Have you found any latest best practices?
We haven’t actually noticed any changes at all for Microsoft Ads tracking since that is totally independent of GA4 and doesn’t even integrate with GA4. Here are some key insights and best practices to ensure effective conversion tracking:
Tracking setup:
Make sure your Microsoft Ads are tracking through Google Tag Manager.
Clarity integration:
Microsoft has started deploying Clarity automatically on sites, which can slow down the tag deployment. This delay might result in missing conversion data. To avoid this, ensure Clarity runs through a separate tag rather than piggybacking onto your UET tag.
Unified triggers:
When using GTM, use a single trigger for multiple tags. For example, a form fill trigger should send data to GA4, Facebook Ads, Google Ads, and Microsoft Ads simultaneously. This reduces discrepancies between different tools.
Attribution settings:
Align your attribution settings between GA4 and Microsoft Ads. Below are the steps to check and adjust your attribution settings :
- Go to GA4 “Admin” settings.
- Select “Data Settings” and then “Attribution Settings”.
- Verify and adjust the attribution model (e.g., last click) to match Microsoft Ads.
- Check the “attribution window settings” (e.g., 7 days for clicks, 30 days for conversions).
Overcoming GA4 issues for small e-commerce stores
How can a small e-commerce store overcome issues like cardinality, thresholding, data retention, and data delay in GA4?
Let’s break down each of these issues and provide solutions:
Cardinality
Cardinality refers to the number of unique values in a custom dimension. If a custom dimension has over 500 unique values in a day, GA4 groups data under “Other,” which can obscure detailed reporting.
Avoid creating custom dimensions with high cardinality.
- For example, using a transaction ID as a custom dimension is unnecessary since it’s already built-in.
- Instead, use GA4’s default dimensions or reduce the number of unique values tracked.
Thresholding
This used to be an issue in GA4 before March 2024, but no longer is.
Data Retention
Data retention settings impact how long GA4 stores data, affecting explorations but not standard reports.
- Check that your data retention settings (in Admin) are set to 14 months and set up the BigQuery export.
- The 14 month data retention setting does only impact what you see in Explorations, though!
Data Delay
GA4 does have a data delay of 24 to 48 hours for new data, and it can sometimes take up to 7 days for attribution to be completely set.
- Unfortunately, there isn’t much you can do about that except move to another tool that offers real-time analytics streaming (which isn’t cheap!).
Overall, these issues don’t impact most GA4 accounts, and likely wouldn’t impact a small e-commerce store, except for the data delay.
Follow-up question: Which analytics tool do you recommend to avoid data delay?
There is no definite answer—real-time or streaming analytics are pricey because they provide data without delay. If you need immediate data, be prepared to pay for it. For most businesses, waiting a few hours for data processing is fine and more affordable. Assess whether real-time data is critical for you. If not, standard tools with slight delays might be sufficient.
Tools like Fathom come to mind—I’m pretty sure it didn’t have a data delay but double-check that to be sure. Matomo is another tool to consider. It’s popular for being GDPR compliant and is gaining traction among those frustrated with GA4.
Track clicks on monthly ad promotions in primary navigation
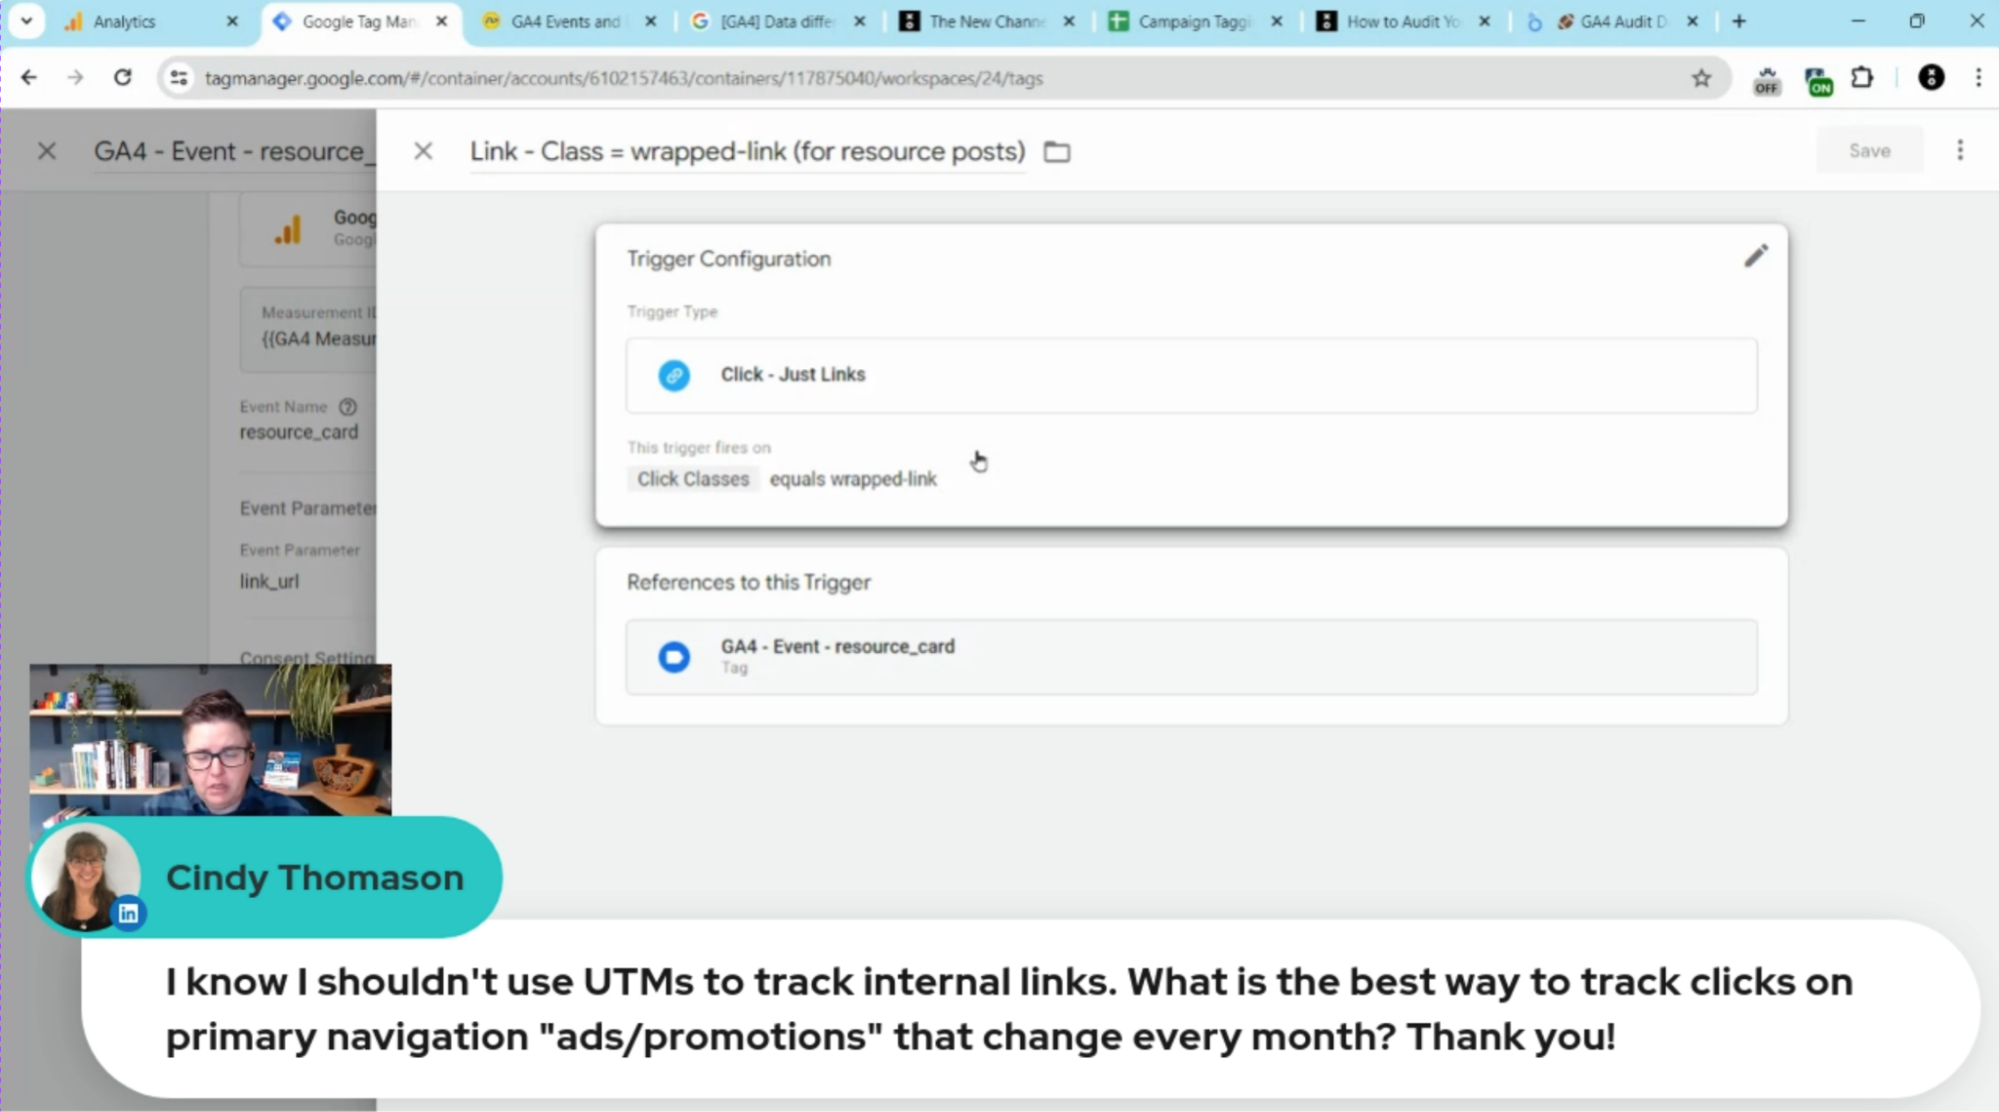
I know I shouldn’t use UTMs to track internal links. What is the best way to track clicks on primary navigation ad promotions that change every month?
First, let’s talk about why you shouldn’t use UTMs to track internal links. In Universal Analytics, if you clicked an internal link that had a UTM, your session would end and a new session would begin, messing with your attribution. This doesn’t happen in GA4 but it also means that you wouldn’t see that UTM show up in your reports. Just don’t do it.
What we recommend is using Google Tag Manager to create events in GA4 based on engagement with specific items, such as your promotional images. The Analytics Playbook GTM container tracks an event every time an image is viewed on our site and monitors if people click on related resource links in our resource posts. This setup can give you a starting point for your own tracking!
- Navigate to GTM.
- Set up a new tag for the “select promotion” event.
- Use recommended parameters such as
- creative_name, creative_slot,
- promotion_id, promotion_name, and
- optionally items.
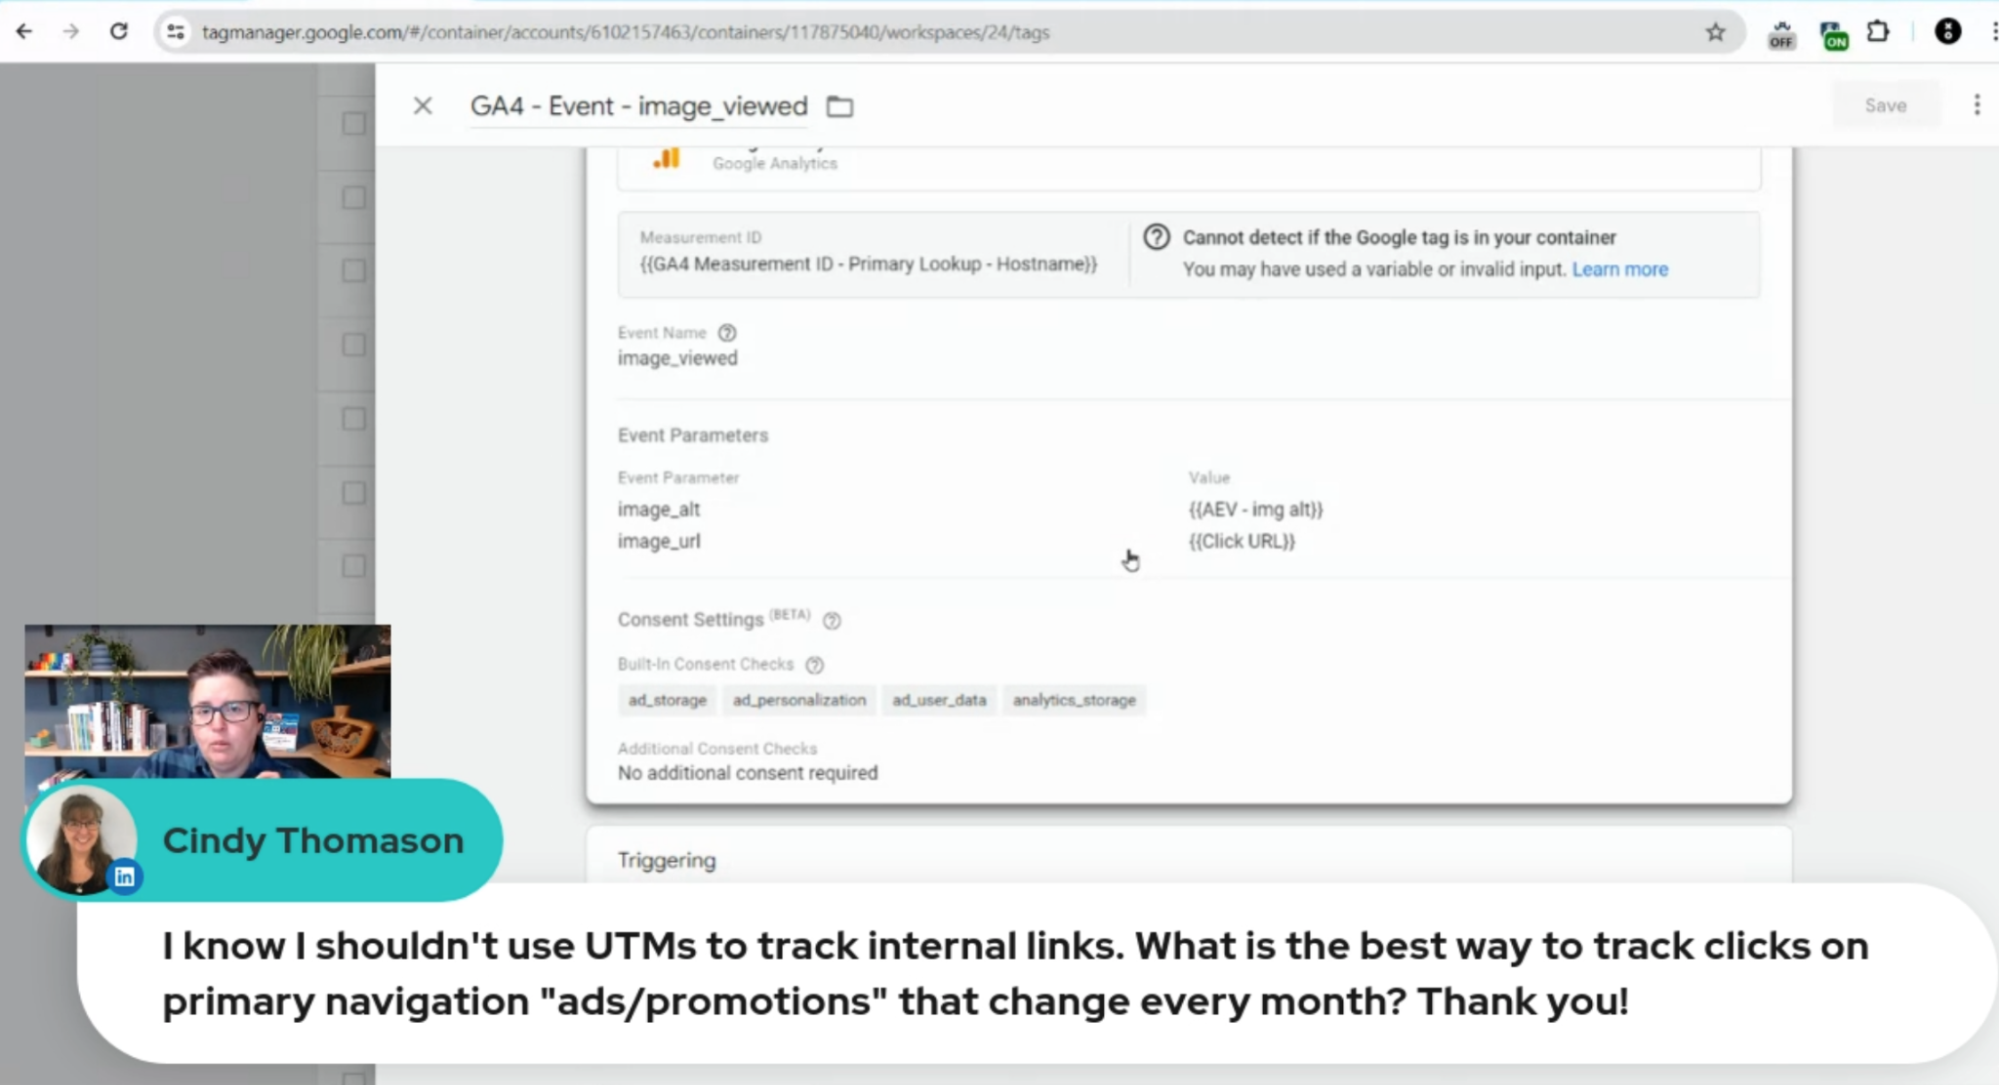
Track image views:
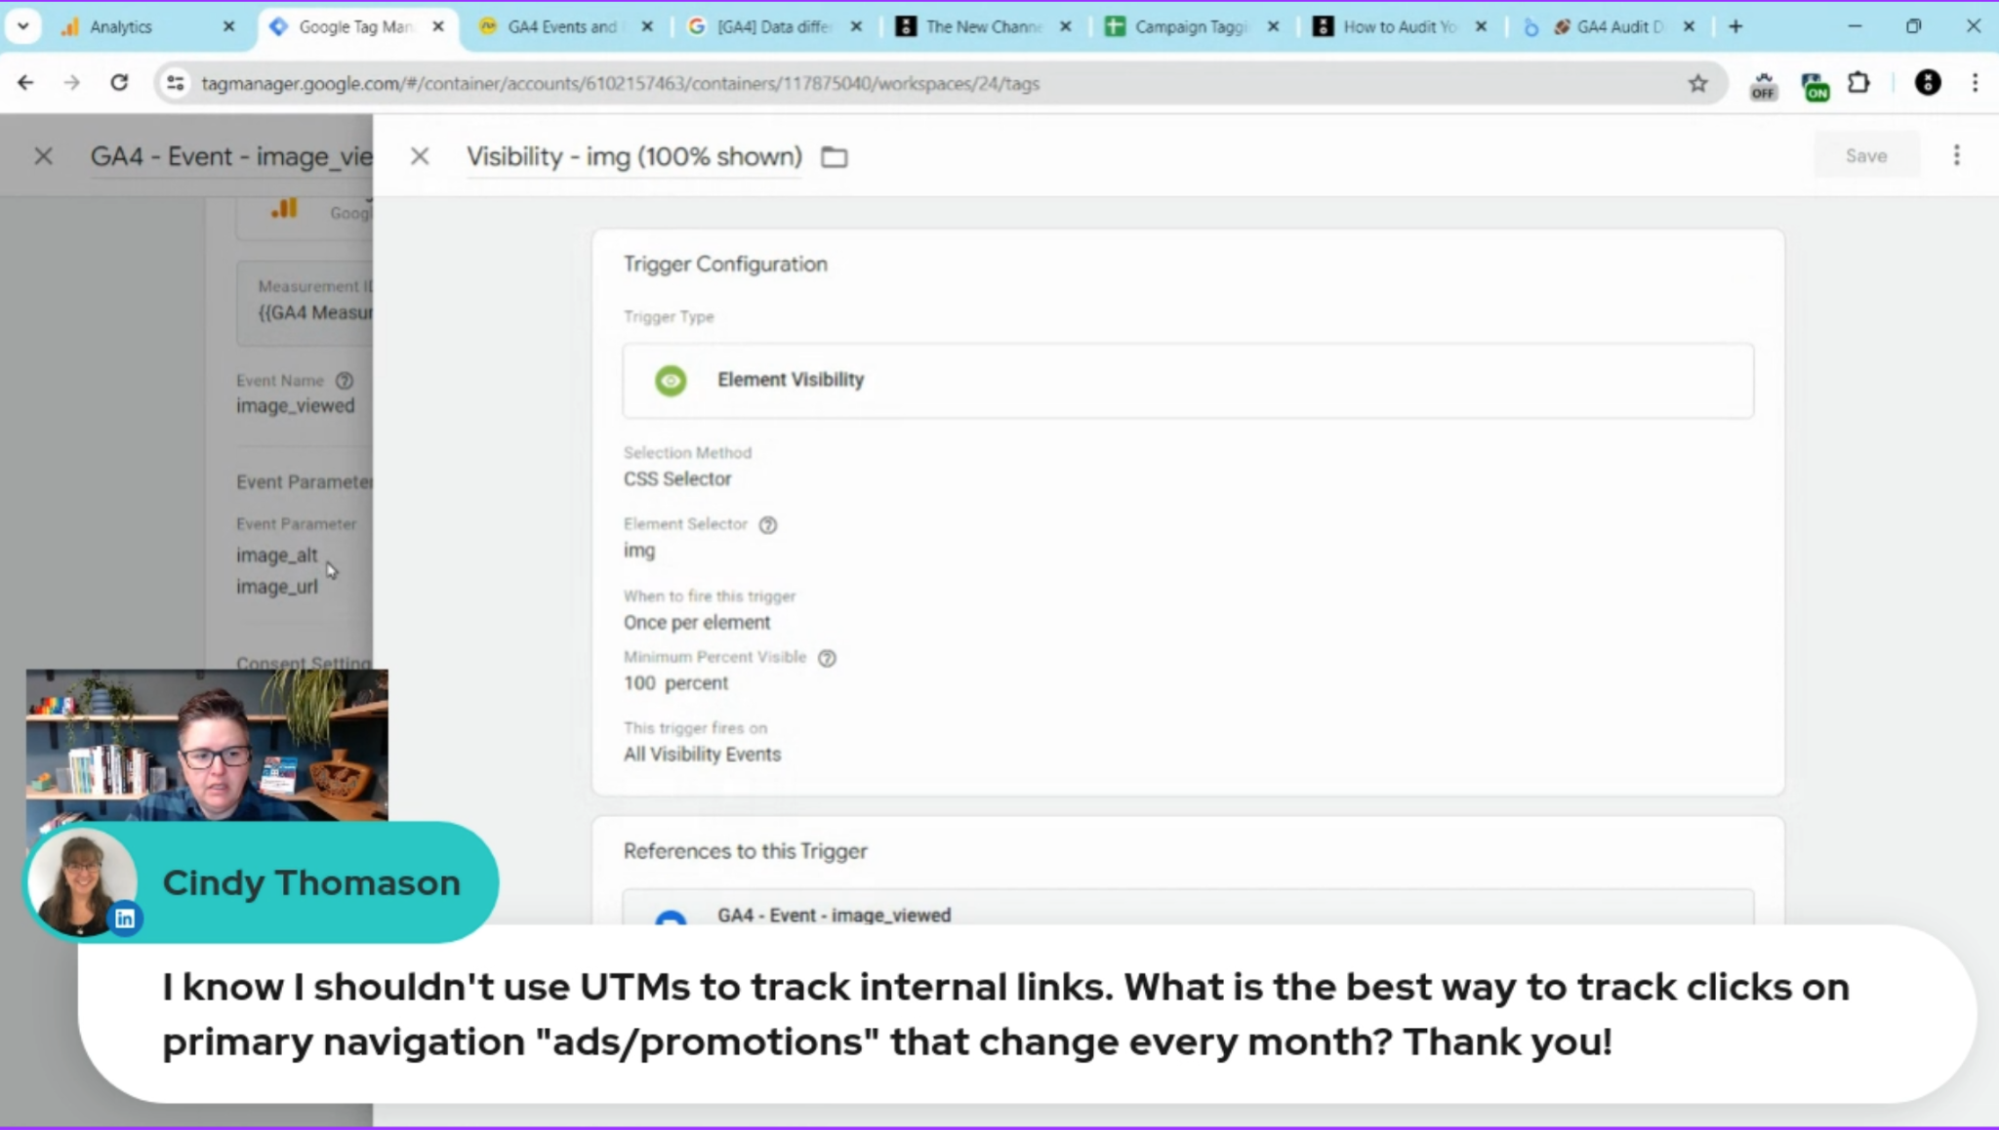
Track promotions effectively by setting up triggers in GTM:
- Create an event to track if a promotion image is viewed.
- Set up a trigger in GTM for when an image is 100% shown on the page.
- Capture event parameters like the alt tag and Click URL.
Track clicks on promotions:
- Set up another event tag in GTM for when the promotion image is clicked.
- Use a click trigger instead of a visibility trigger.
- Store the URL of the clicked image using the Click URL variable.
For example, on our site, we track clicks on related resources using a click class wrapped around each resource link, called Wrapped Link. When a user clicks on any related resource, we record the interaction using the click class of the Wrapped Link.
So by inspecting the code, you can identify any unique elements that can be tracked, allowing you to capture user engagement with promotions accurately.
Track URL and create custom metrics:
- Use the Click URL variable to capture the URL of the clicked image or link.
- Create custom metrics to compare the number of views versus clicks on promotions. This helps in understanding engagement levels.
💡 When setting up your tracking, use clear and descriptive names for your images and URLs to simplify reporting. Avoid using generic names like “Promotion May Final Final Final 3,” which can create confusion during analysis. Instead, name your promotional assets based on their specific content and purpose.
Exporting Google tags
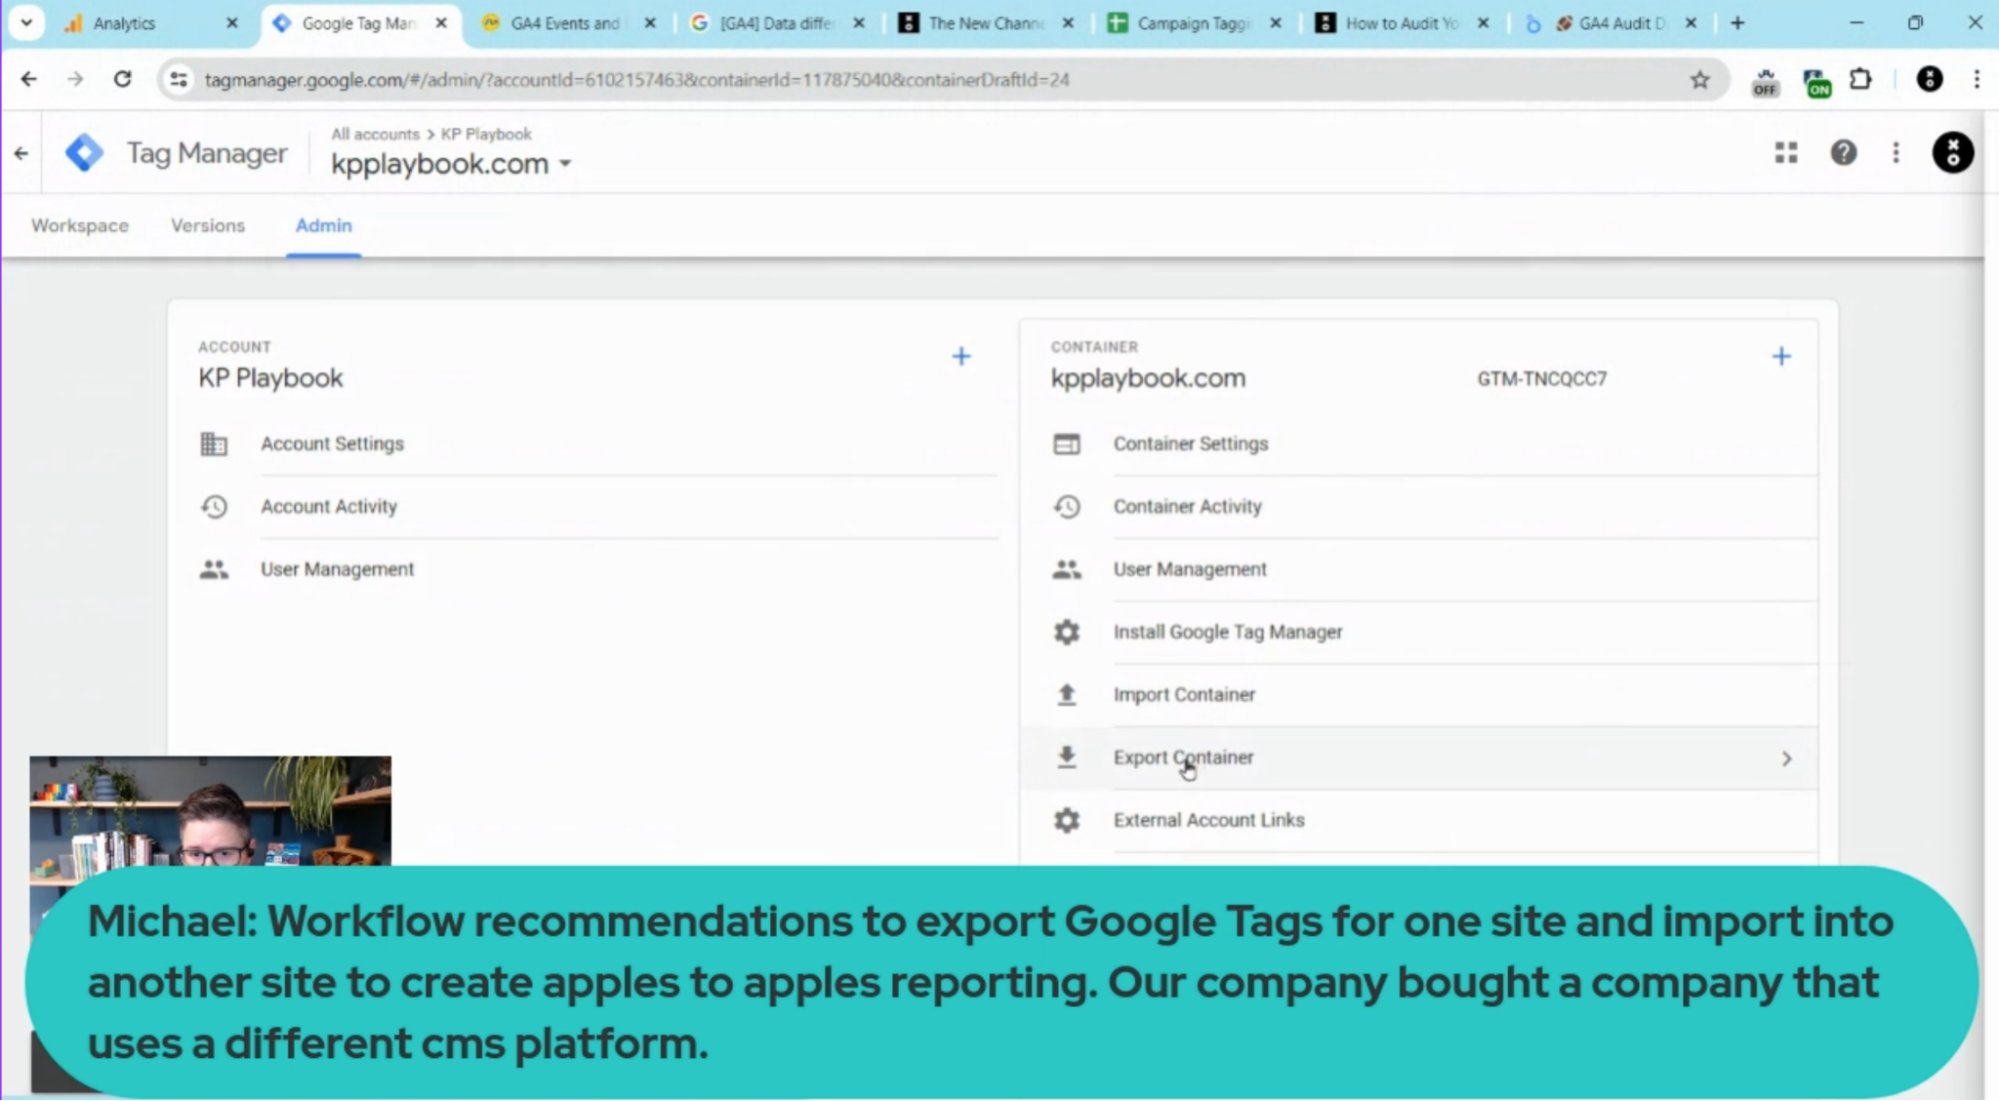
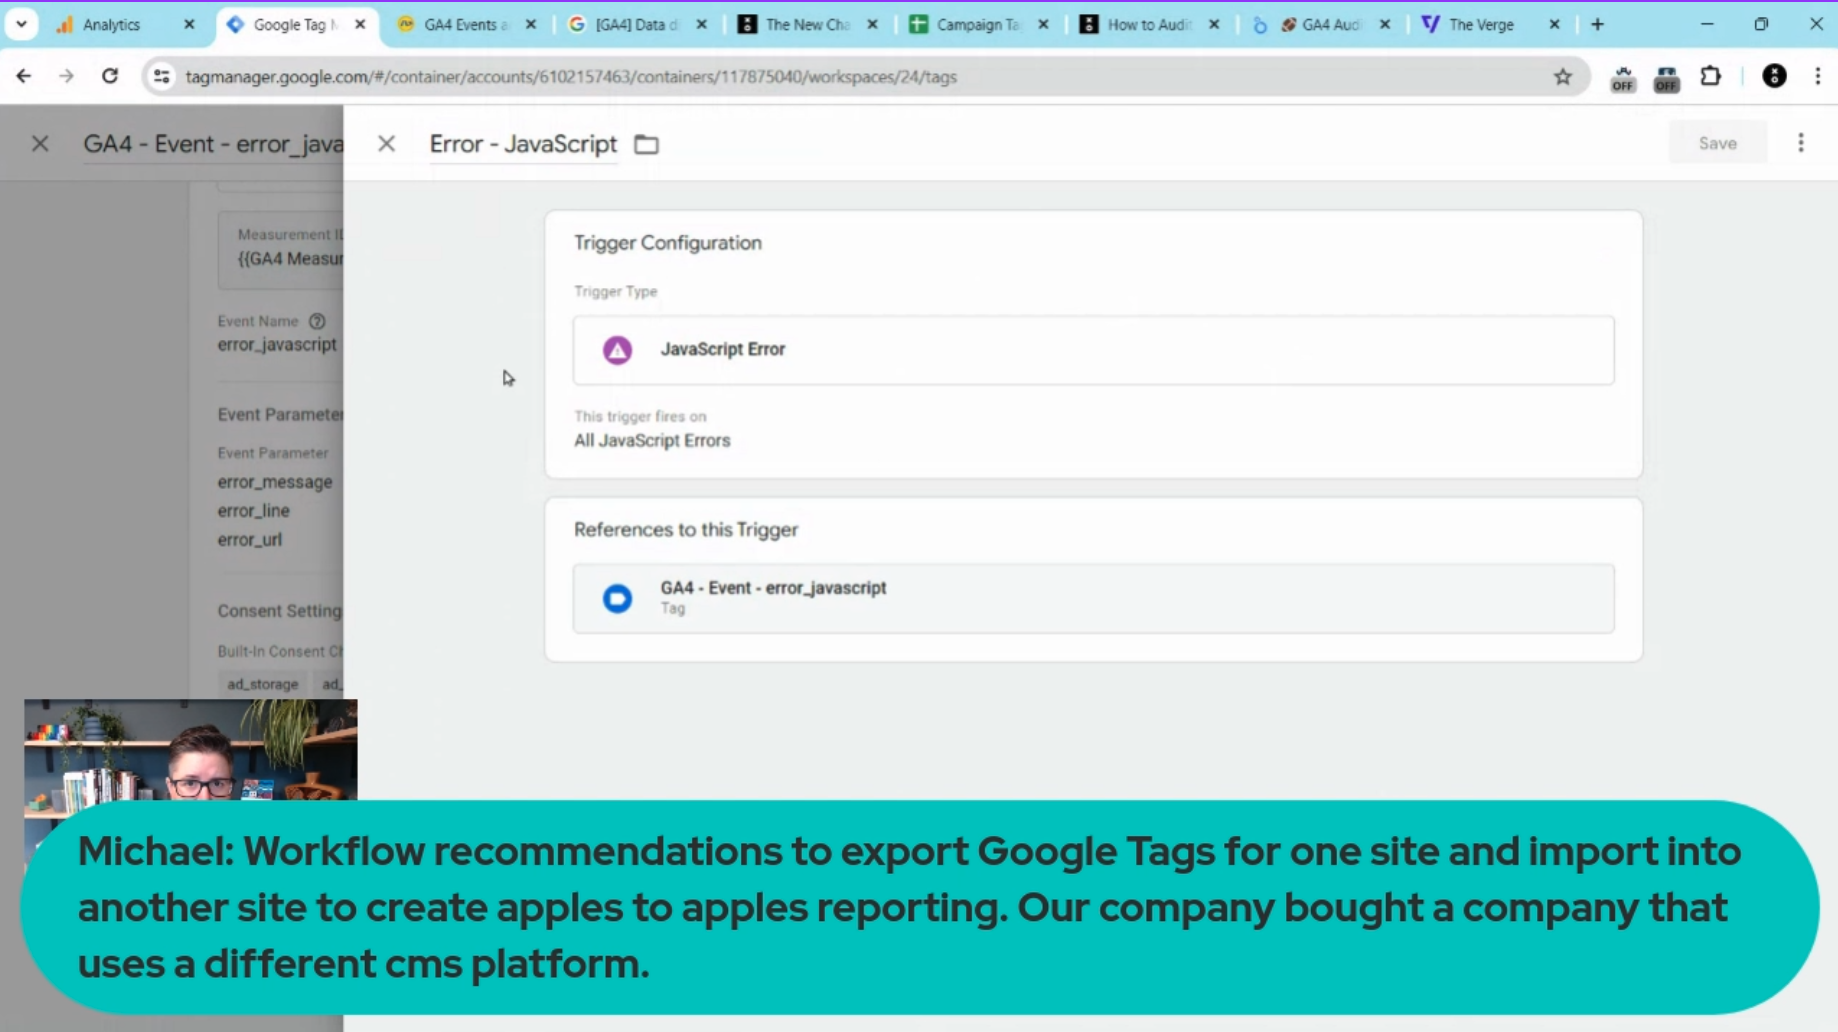
What are your workflow recommendations to export Google Tags from one site and import them to another for consistent reporting, given that our company acquired another company using a different CMS platform?
You might want to use the same GTM container on both sites and then use the hostname as a requirement on the triggers to ensure that the correct trigger is running on the correct site. Then, you can have more than one trigger for a single tag—that way you can have an event that is triggered one way on your first site and another way on your second site, but the resulting event name is exactly the same, with exactly the same parameters.
Working in a single container also makes changes easier as you’re less likely to forget to update a totally separate container every time you need to make a change in your primary container.
Export and import Google Tag Manager (GTM) container:
- In GTM, go to the “Admin” section.
- Select “Export Container” to download your current container settings.
- Import this container into the new GTM account and modify it as needed to fit the new site’s structure.
Adjust for different CMS platforms:
Be aware that differences in CMS platforms mean you might need to adjust class names or other elements unique to each platform. This ensures that the tracking remains consistent across both sites.
💡 Use consistent naming conventions and double-check that all elements are correctly tracked.
Hostname lookup table variables in GTM for multiple sites:
Consider using the same GTM container for both sites with hostname lookup variables. This way, you can manage all tags in one place.
- Set up a hostname lookup table variable in your GTM container.
- Configure different sets of tags to fire based on the hostname, ensuring accurate tracking for each site.
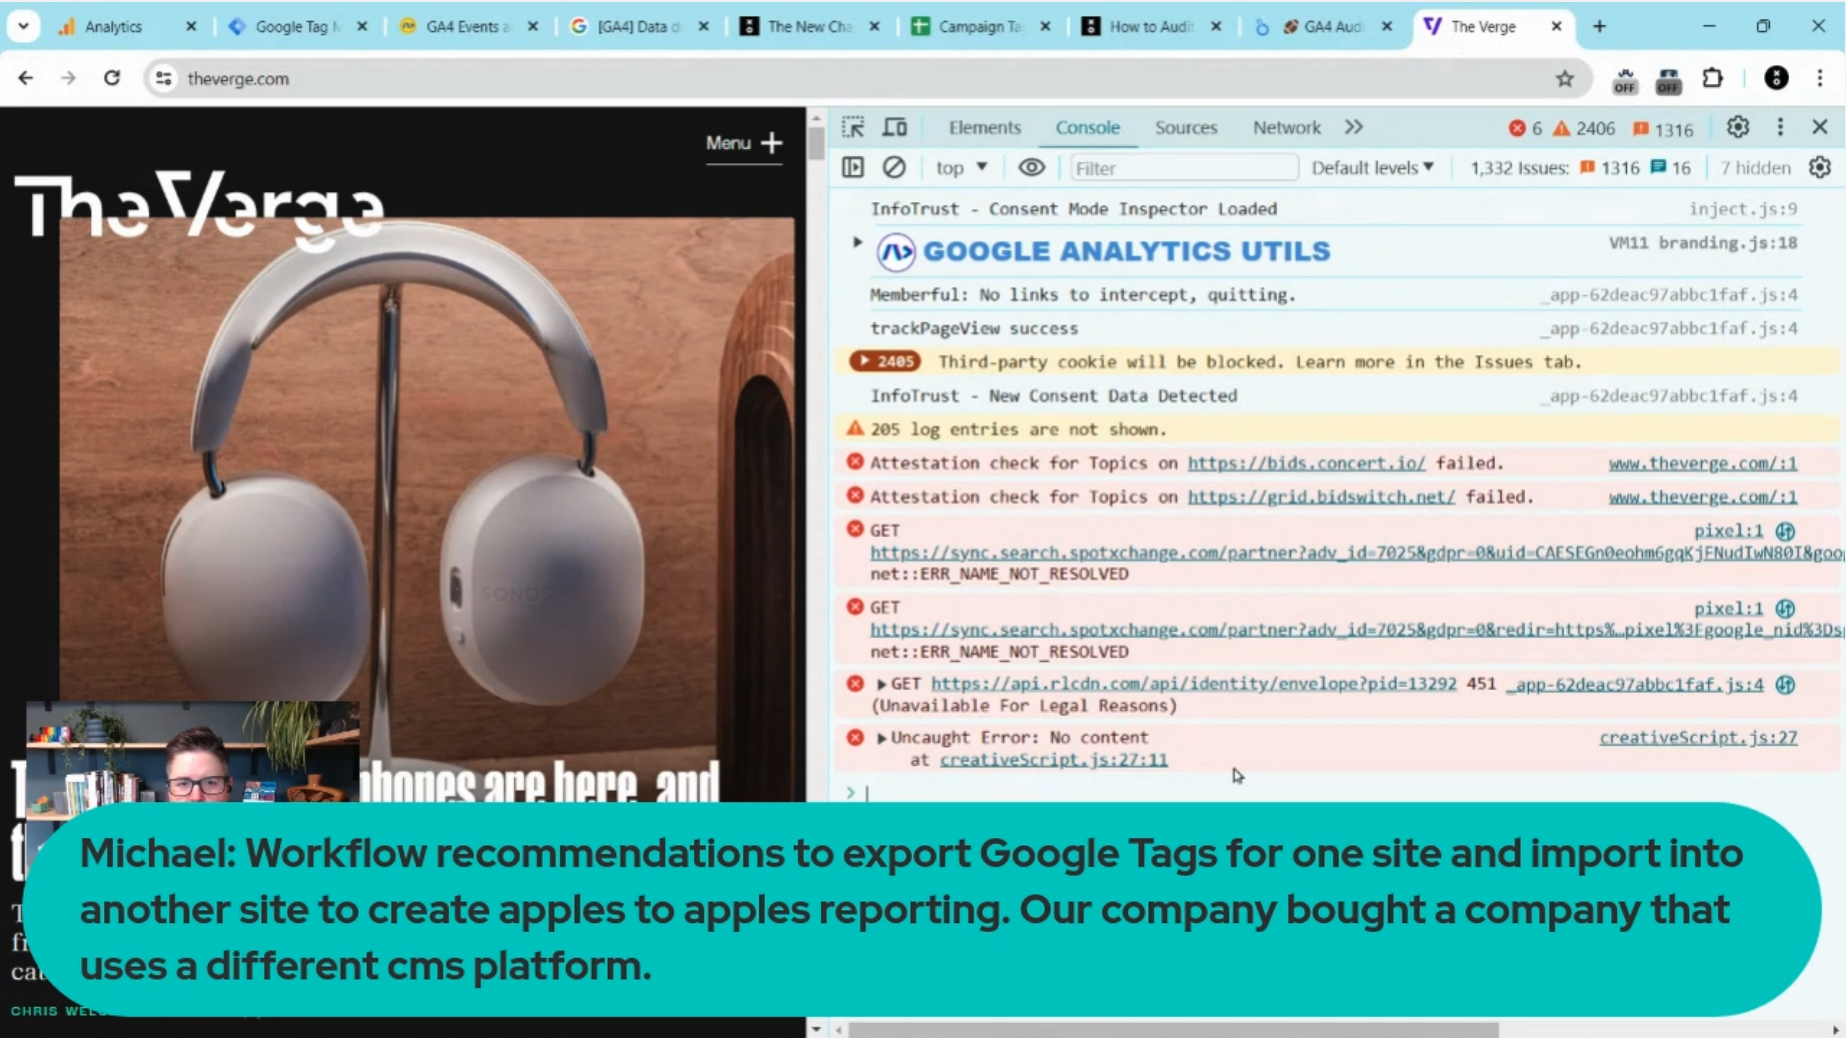
Monitor JavaScript errors:
JavaScript errors can interfere with accurate analytics tracking. It’s crucial to monitor and address these errors.
To check for errors:
- Use browser DevTools (right-click > Inspect > Console) to look for JavaScript errors.
- Look for anything showing up in red.
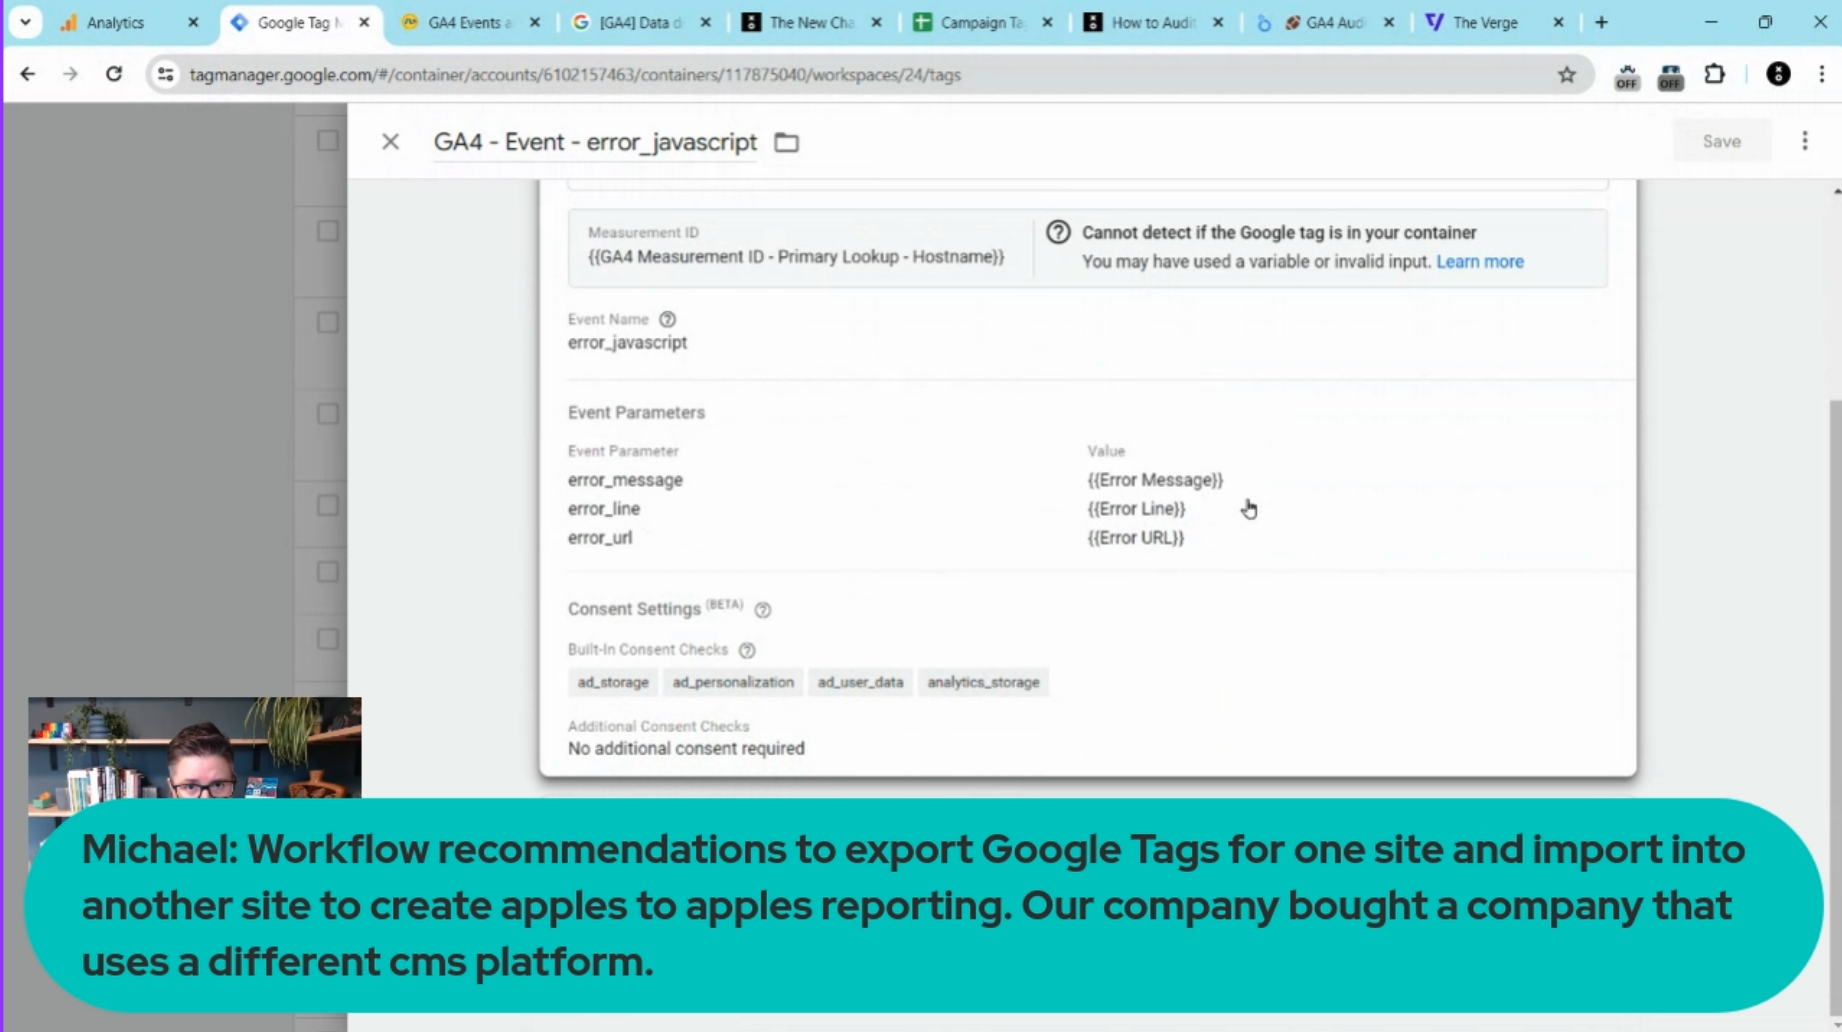
To set up JavaScript error tracking:
- Create a GA4 Event Tag:
- Navigate to your GTM account.
- Create a new tag for the event—we name it error_javascript.
- Use built-in variables as event parameters to capture the error message, error line, and error URL.
- Set Up The Trigger
- Create a new trigger that activates when a JavaScript error occurs.
- Use the built-in GTM trigger type for JavaScript errors.
- Link the event tag to the trigger you just created.
Still feeling overwhelmed by GA4?

Kyra made her start in the world of digital marking in 2022 as an apprentice and has developed a passion for SEO and content creation. She is a Social Media Specialist at Analytics Playbook and helps write the newsletter.
Learn more about Kyra