
While creating a Google Ads Looker Studio dashboard for a client we needed a way to calculate Ad Spend per Day. Google Ads only reports on the total cost (using the Cost metric), not how much was spent each day. There is an average cost field in Looker Studio, but it isn’t actually calculating the average cost per day.
Watch the video below or keep reading for the solution we put together!
Calculating the total number of days in a selected date range in Looker Studio
To calculate Ad Spend per Day, we would take the total spend in the time period, and divide it by the number of days that are currently selected in the date control on the report.
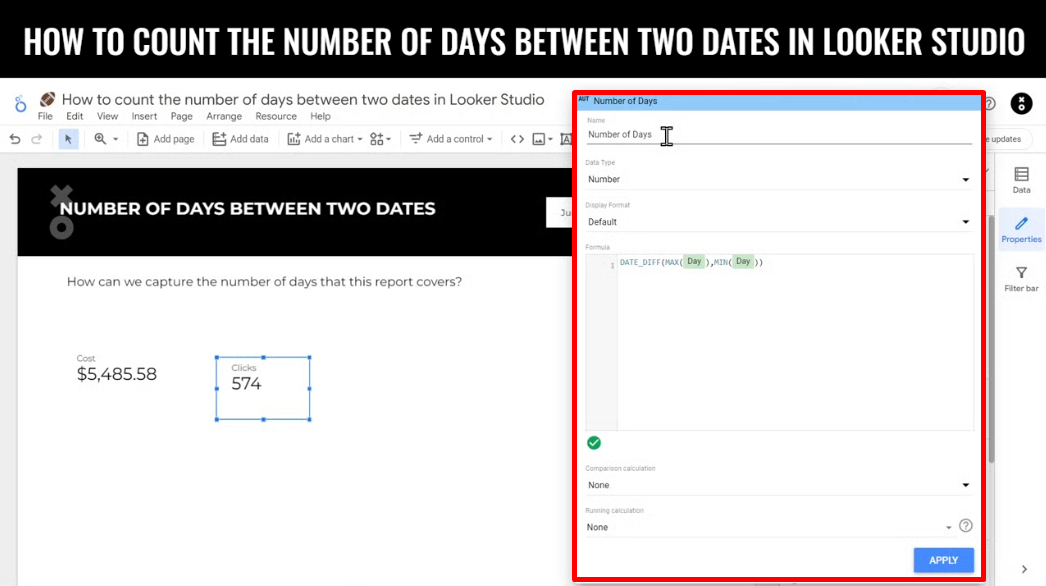
How can we capture the number of days that this report covers so that it’s always accurate, even when the date range is changed to the last 30 days or the last year?
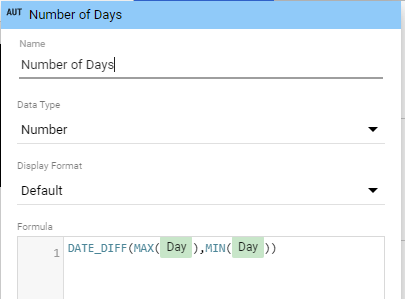
We’ll use a calculated field to return the number of days in our currently selected date range. The calculated field is:
DATE_DIFF(MAX(Day),MIN(Day))
Here are the Looker Studio functions involved in that formula:
- The DATE_DIFF function calculates the number of days between two dates, and the first date should be the end date, and then the start date.
- The MAX function returns the highest value, as in the latest date that exists in the currently selected date range.
- The MIN function returns the lowest value, as in the earliest date that exists in the currently selected date range.
📆 Note that the Google Ads connector for Looker Studio uses “Day” for their date field, not “Date” like other Google data sources, including GA4.
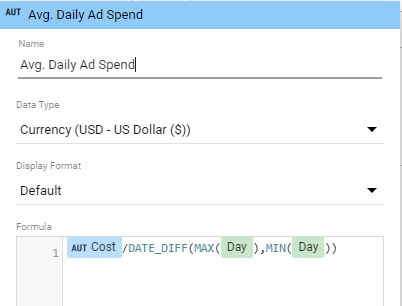
Then, our calculated field for the Ad Spend per Day is:
Cost/DATE_DIFF(MAX(Day),MIN(Day))
Get more analytics and reporting tips
Adding the Ad spend per day calculation in a Looker Studio report
- Click Add a chart and select Scorecard
- In the Scorecard click Metric name and Add Field
- In Formula add DATE_DIFF(MAX(Day),MIN(Day))
- Name the field Number of Days
- Click Apply
Now we are going to do the actual math to calculate the Ad Spend per Day
- Click Add a chart and select Scorecard
- In the Scorecard click Metric name and Add Field
- In Formula add Cost/DATE_DIFF(MAX(Day),MIN(Day))
- Name the field Average Cost Per Day
- Click Apply
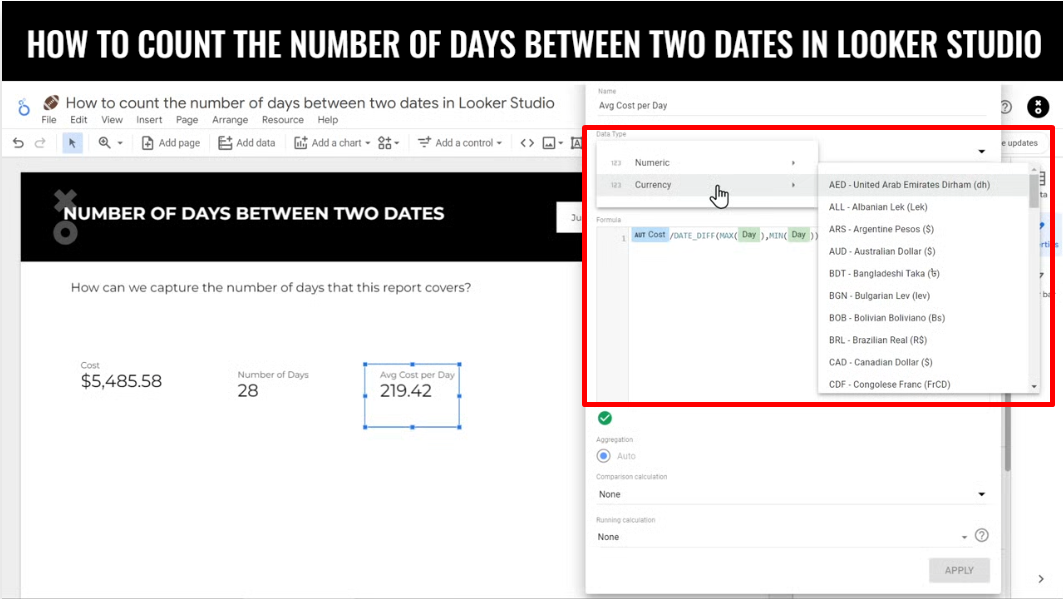
If you want the Average Cost Per Day to show up as a currency as opposed to a number
- Click the Data Type dropdown
- Select Currency and choose the applicable currency
- Click Apply
Have a question or are having problems getting this calculated field to work for you in Looker Studio? Head over to our YouTube video and leave a comment.
Want more Looker Studio how to's?

Dana enjoys solving problems that haven’t been solved before. With her 20+ years experience in digital marketing and teaching, she has a knack for distilling complex topics into engaging and easy to understand instruction. You’ll find Dana sharing her knowledge at digital marketing conferences around the world, teaching courses, and hosting a technology column.
Learn more about Dana