When you start tracking AI traffic in GA4, you likely begin your analysis by looking at traffic numbers and landing pages. That’s a great first step, but there’s a whole other level of insights waiting once you move from counting AI visitors to understanding their behavior patterns.
When Jason Dodge asked me about AI traffic analysis during a recent Analytics for Agencies office hours session, we walked through the GA4 audience strategies I use to transform AI traffic data into actionable business intelligence. And now I’m going to share those strategies with you!
Prefer to watch instead of read?
What AI Traffic Audiences Reveal About Customer Behavior
If you’ve been tracking AI traffic coming to your website (and if you haven’t, you should!) you likely have a few charts showing the growth of AI traffic over time. It might not be a lot, maybe only 2% of your overall traffic, but it’s growing fast.
But traffic on its own, especially such a small volume of traffic, isn’t enough to get stakeholders engaged with the data. They’re likely asking you “Okay, so what should we do with this information?”
That’s actually the perfect question — and it means they’re ready for the next step. Tracking AI traffic is important, but analyzing AI traffic behavior is where the real insights live.
Google Analytics audiences are my favorite method to build sophisticated segments to understand AI’s true role in customer journeys. Audiences in GA4 only start building once you create them, so this is something you should set up as early as possible.
Tip: If you want to look backwards with these audiences, you can use segments in Explorations. They work in very similar ways and can look through past data but can’t be used in standard GA4 reports or in Looker Studio.
Before we dive in, make sure you have followed my tutorial to set up an AI traffic channel in GA4. The audience strategies I’m about to show you build on that foundation.
The Foundation: First User and Session AI Traffic Audiences
First, let me explain what “first user” and “session” actually measure in GA4, because this distinction is important for understanding what it means when it comes to website visitor behavior.
First User refers to the very first way someone got to your website. GA4 tracks this as part of the user’s permanent record, so if someone’s first-ever visit to your site came from ChatGPT, that “first user source” stays with them forever, even across multiple future visits.
Important: Some privacy-focused browsers wipe cookies after a short period of time, so people could show up as “first” even when they aren’t. Same goes for multiple devices, the “first” visit might not be that person’s first visit, but it was the first visit from that specific device.
Session refers to individual visits — it could be their first visit, or their twentieth. For example, a visitor might first discover you through ChatGPT, then return via Google search, then come back through direct traffic. Each of these is a separate session.
Let’s consider what this means for our audiences. If someone’s first user source is ChatGPT, they’re likely in discovery mode. But if they return later and their session source is ChatGPT (while their first user source was something else), they might be using AI tools in a completely different way: perhaps for quick answers or to validate something they already know about your business.
The distinction between first user and session AI traffic will change how you look at this information! For example, I was working with an e-commerce client recently who saw a big jump in conversions from AI traffic. When we dug into this data with audiences, we saw that:
- First-touch AI users: 0.8% conversion rate (discovery phase, still shopping around and not ready to buy)
- Later-touch AI users: 6.2% conversion rate (returning customers likely convinced by repeat AI mentions)
That’s a completely different story than “AI traffic converts at 3.9%,” isn’t it?
Setting Up First Touch AI Audience in GA4
We’ll start with the First User audience.
Step 1: Access GA4 Audience Builder Navigate to Admin > Data display > Audiences.
Step 2: Create First Touch AI Audience
- Click “New audience” then “Create a custom audience”
- Set the audience name: “First Touch AI Traffic”
- Add condition: “First User (the name of your custom channel group)” exactly matches “AI Tools” (or whatever you named your AI channel). For example, our custom channel group is named “Custom Channel Group” so we’d pick “First User Custom Channel Group”.
Your audience should look like this:
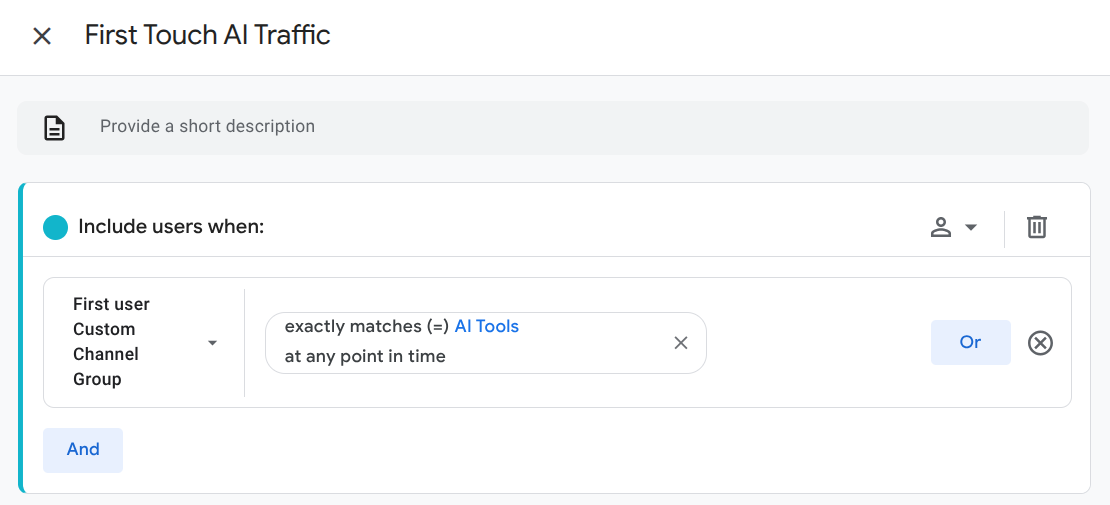
This captures people whose very first interaction with your site came from AI tools.
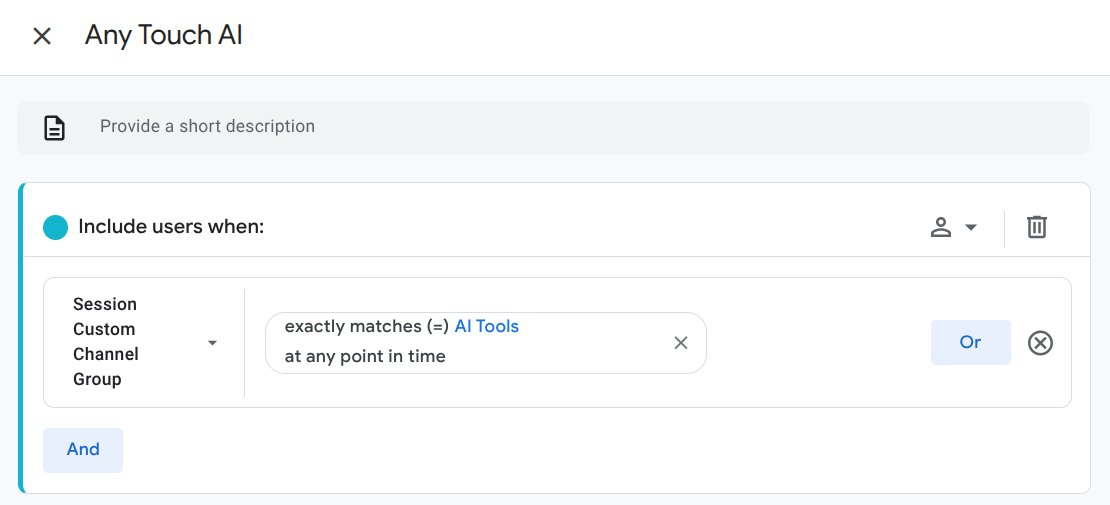
Session AI Audience for Any Touch Analysis
Next we’ll create our session AI audience.
Step 3: Create Any Touch AI Audience
- Click “New audience” then “Create a custom audience”
- Set the audience name: “Any Touch AI Traffic”
- Add condition: “Session (the name of your custom channel group)” exactly matches “AI Tools” (or whatever you named your AI channel). For example, our custom channel group is named “Custom Channel Group” so we’d pick “Session Custom Channel Group”.
Your audience should look like this:
Session but not First User Audience for Return Journey Analysis
This audience gathers together visitors who came to the site via AI tools but not as their first visit.
Step 4: Create Return Touch AI Audience
- Create new audience: “Return Touch AI Traffic”
- Add condition: “Session (the name of your custom channel group)” exactly matches “AI Tools” (or whatever you named your AI channel). For example, our custom channel group is named “Custom Channel Group” so we’d pick “Session Custom Channel Group”.
- Click Add Group to Exclude, then add the condition: “First User (the name of your custom channel group)” exactly matches “AI Tools” (or whatever you named your AI channel). For example, our custom channel group is named “Custom Channel Group” so we’d pick “First User Custom Channel Group”.
Your audience should look like this:
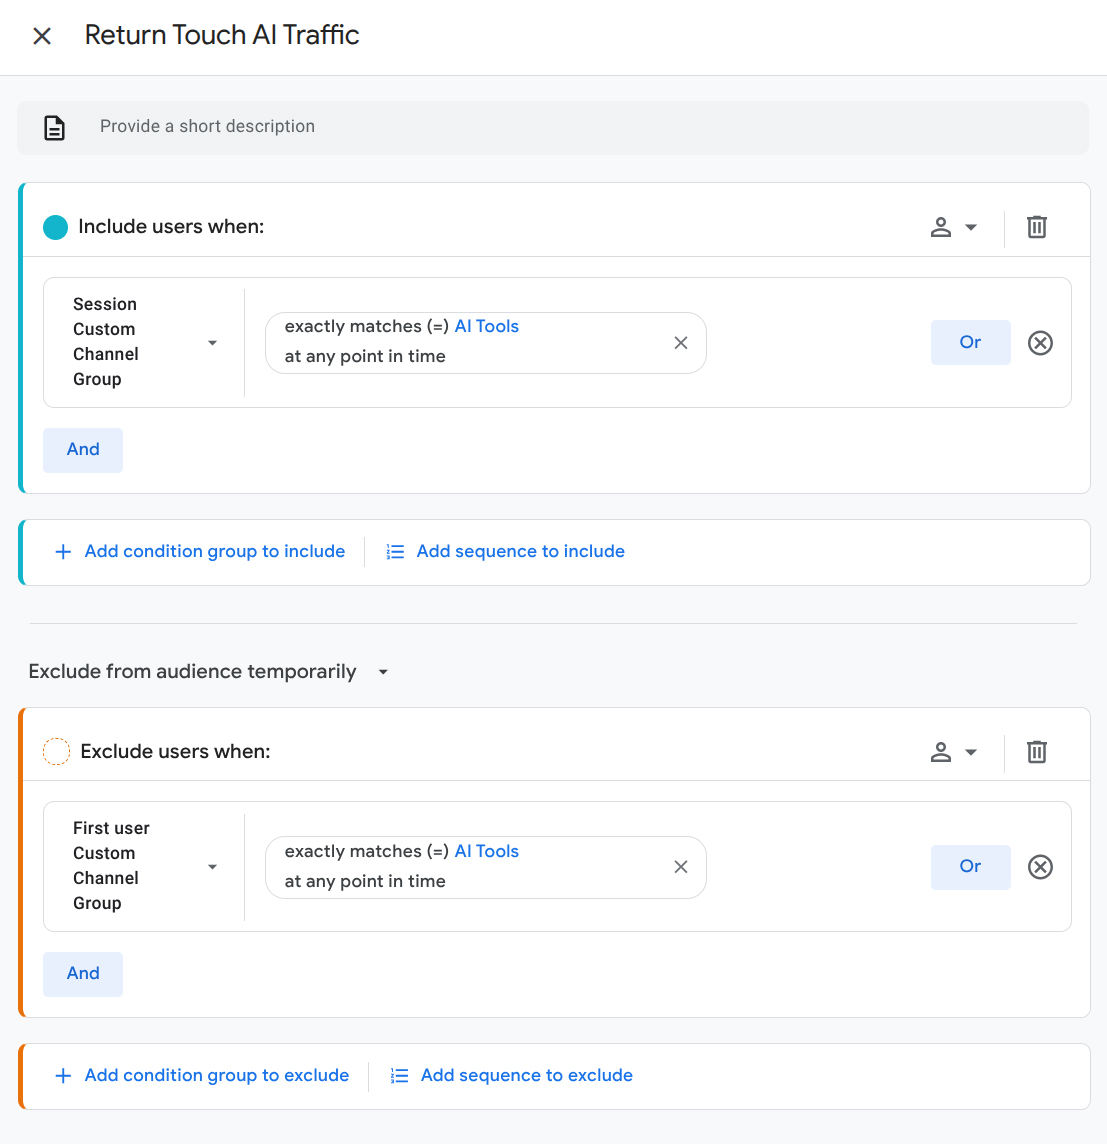
This audience reveals people who came via AI at some point, but not as their very first touch. These users represent AI’s influence on return customer behavior – which could be a much more valuable segment, depending on your industry and how customers find you.
Zero Touch AI Audience
Our last audience are visitors who have never used an AI tool to get to your website.
Step 5: Create Zero Touch AI Audience
- Create new audience: “Zero Touch AI Traffic”
- Click the trash can icon for the Include users when item.
- Click Add Group to Exclude, then add the condition: “Session (the name of your custom channel group)” exactly matches “AI Tools” (or whatever you named your AI channel). For example, our custom channel group is named “Custom Channel Group” so we’d pick “Session Custom Channel Group”.
Your audience should look like this:
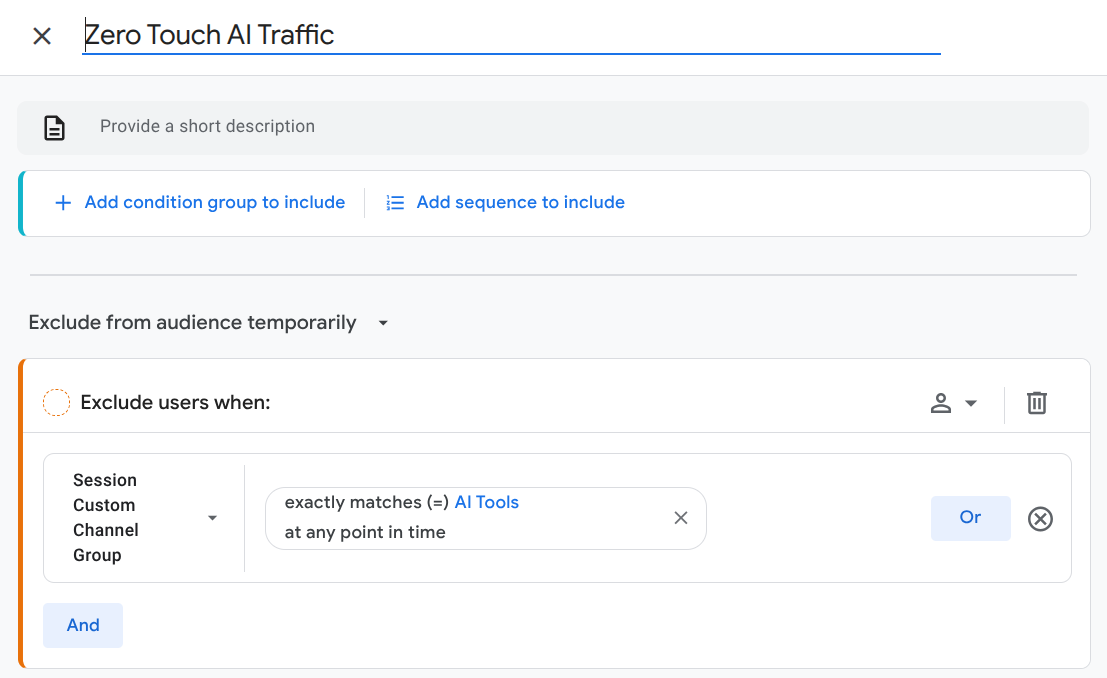
This is your control audience that you can use as a benchmark of typical behavior against your new AI audiences.
Using GA4 Audiences to Analyze AI Traffic Behavior
Now that you have your audiences, let’s talk about what you can do with them.
How Does AI Fit Into Your Business Context?
Think about your customer behavior patterns and typical journeys. Are you dealing with:
- Immediate Need — Pest Control Scenario: You’re not shopping around in case you get termites at some point, right? Instead, you have an urgent need. There’s something gross in your house and you need it out, NOW! In this case, there may only be one touch, which makes the first touch the same as the last touch. AI traffic either converts quickly or doesn’t convert at all.
- Consideration Stage — Moving Company Scenario: You could be preparing for a move months in advance. You might ask ChatGPT “tell me the best moving companies in Austin,” and then go through that list systematically. Even if you get a quote through the online system, you won’t necessarily book immediately. You’ll probably email the quote to yourself and come back later via directly typing in the URL, keeping the tab open for days or weeks, or by calling to book.
This context helps you determine what you would expect to see from your AI traffic, and then these audiences will tell you if reality lines up to your expectations.
Example of an AI Audience Analysis
Let’s say you’re working in e-commerce, selling a product that customers typically consider and compare before purchasing.
In that case, this is what I’d expect to see from these audiences:
- First Touch: Lower immediate conversion, higher return rate
- Return Touch: Higher conversion intent
- Any Touch: An average between First and Return
- Zero Touch: Your benchmark for comparisons
How can you tell if there is a higher return rate from any of these audiences compared to your benchmark? That’s where the Cohort Exploration comes in.
Using Cohort Explorations to Evaluate Visitor Return Rates
Here’s where this gets really powerful. I use these audiences as inclusion criteria in GA4’s cohort exploration to see how they stack up.
Quick explanation if you’re new to cohort analysis: A cohort is a group of users who share something in common – for example, how they first arrived at your site. Cohort analysis lets you track these groups over time to see if they come back, and if so, how often and what they do when they return. For example, you might track everyone who first visited in January and see how many came back in February, March, and so on. This is incredibly useful for AI traffic analysis because it reveals whether AI-influenced visitors are just one-time browsers or if they’re more likely to return and eventually convert. Instead of looking at all your traffic as one big group, cohort analysis shows you how different types of visitors behave differently over time.
If you haven’t used a cohort exploration before, here’s how to set it up:
- Go to Explorations and scroll right through the list, then click on Cohort exploration.
- Click the + symbol next to Segments and click Create a New Segment.
- Click User segment, then follow the same steps we went over above to create the segment(s) that you want to evaluate.
- Select Rolling for the calculation: this way, you’re not distracted by the individual numbers but instead looking at the data directionally.
Your cohort analysis would look something like this:
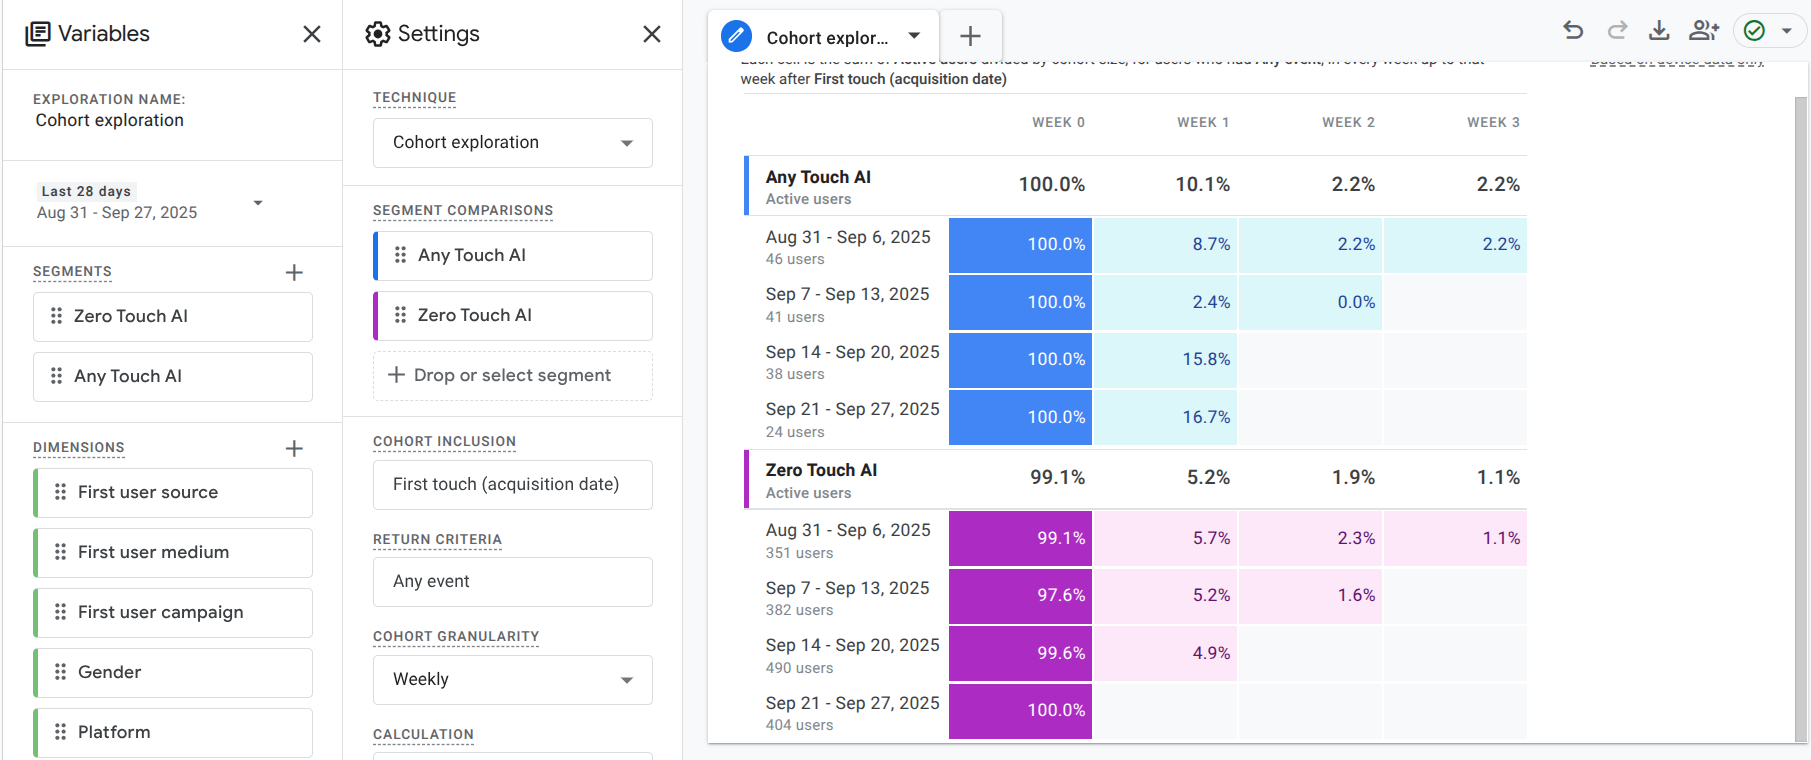
By default, the inclusion criteria is the first touch and the return criteria is any event, but we can modify this to be more specific. For example, select any transaction or any conversion as your return criteria to see how these audiences compare. I’ve generally found that AI audiences tend to have higher return rates and higher conversion rates than non-AI audiences.
This completely changes how you evaluate the ROI of AI traffic, doesn’t it?
From Audiences to Actionable Business Intelligence
Creating these audiences and the cohort exploration is just the beginning. Now we’ll turn these insights into actionable business intelligence that can drive your marketing decisions.
Comparative Analysis Framework
Here’s my standard framework for extracting actionable insights from AI traffic audiences:
Conversion Rate Analysis Compare performance across your audiences. You can do this by adding audiences as a filter or comparison in any GA4 report, by adding them in Looker Studio, or by looking at the Audiences report. In particular, I like to compare these audiences:
- First Touch AI vs Zero Touch AI
- First Touch AI vs Return Touch AI
- Any Touch AI vs Zero Touch AI
Engagement Quality Metrics Look beyond conversion to understand behavior quality:
- Session duration differences between audience segments
- Page depth and engagement rate variations
- Return visit patterns and frequency
Customer Lifetime Value Impact This is where AI traffic analysis gets really interesting. I consistently find that AI-influenced customers often show:
- Higher return visit rates
- Faster journey completion from first visit to conversion
- Increased page engagement and content consumption
Looker Studio Integration for Leadership Reporting
If you need to report on these insights to leadership or other stakeholders, don’t show the GA4 interface directly. Instead, create a report in Looker Studio (or your reporting tool of choice) that only shows the insights that can be easily taken away without a lot of heavy explanation. The key is moving from “here’s your AI traffic numbers” to “here’s how AI influences business outcomes.”
Dashboard Structure I Recommend:
- Summary: Explanation page on how AI traffic is measured and what you know about how AI fits into your customer journey
- Journey Analysis: Where AI visitors typically start, and what are their most-viewed pages. How does this compare to Zero AI visitors?
- Audience Performance: Comparative analysis across your different AI audiences
- Optimization Opportunities: Specific recommendations based on these results
You’ll want to be sure that you have your key events and conversions set up only for the actions that actually move the needle for your business for this analysis to be truly useful.
Business Intelligence Integration
If you have a business intelligence (BI) team at your organization, this is a great way to bridge the divide that I often see between marketing and BI teams. Share these insights with the BI team and ask them to help you look even more deeply into how AI influences your customer decisions. For example:
- Customer Research: How do AI-influenced customers differ in surveys and feedback?
- Product Development: What content or products do AI audiences engage with most?
- Marketing Strategy: How should acquisition and retention strategies adapt?
For organizations looking to mature their analytics capabilities beyond basic reporting, this sophisticated approach fits in nicely with my analytics maturity framework.
Frequently Asked Questions
Use my guide to set up tracking for AI traffic separate from other traffic in GA4.
Even if you don’t have a great deal of AI traffic at the moment, audiences don’t backfill — they only start building from the moment you create them. That’s why I recommend setting up these audiences now even if you don’t have enough AI traffic right now to make decisions based on what you’re seeing. AI traffic is only growing, and future you will be thankful you set up those audiences now so you can clearly see the growth of AI traffic over time.
AI tools can sometimes appear as Direct traffic and can’t be captured in an AI traffic tools channel as a result. There isn’t much that can be done about this at the moment. It’s up to the originating site or app to pass along referrer information, and not all websites and apps pass that information along. If a visitor shows up on your site without any referrer information or any UTM parameters in their URL, they’ll be attributed to Direct in GA4.
Ready to Transform Your AI Traffic from Numbers to Insights?
The audience strategies I’ve outlined here help you transform AI traffic from vanity metrics into actionable business intelligence that can drive real marketing decisions.
Here’s what to do next — takes under half an hour:
- Track AI traffic: Verify your AI traffic tracking setup is capturing all major AI tools. This will take about 5 minutes.
- Create your first audience: Set up the AI audiences using the steps I outlined above. It should only take about 10 minutes.
- Begin cohort analysis: Set up the cohort exploration, using the steps I outlined above. This should also only take you about 10 minutes.
Once you have these foundational steps configured, you can start to bring these insights into your regular reviews with leadership, your clients, or other stakeholders. Everyone is excited about AI right now, but these concrete steps will help you get past the hype and see what the actual influence of AI is on your website visits.
And if you’re struggling to communicate results, this is exactly the kind of approach that I teach in my Analytics for Agencies course. Students get access to office hours sessions like the one where Jason and I worked through these exact strategies, plus comprehensive frameworks for implementing advanced analytics that actually drive business decisions.
Your leadership team will finally get AI insights they can actually act on. That’s the difference between analytics and intelligence!
Have questions about implementing AI traffic audiences in GA4? Share your experience in the comments on my YouTube video where I walk through this entire process.

Dana enjoys solving problems that haven’t been solved before. With her 20+ years experience in digital marketing and teaching, she has a knack for distilling complex topics into engaging and easy to understand instruction. You’ll find Dana sharing her knowledge at digital marketing conferences around the world, teaching courses, and hosting a technology column.
Learn more about Dana