Jill Quick, Analytics Consultant and Trainer at the Coloring In Department, recently joined Dana DiTomaso in a live webinar to unravel the complexities of how to craft a comprehensive measurement strategy. Below is the video from the event and a recap of their conversation, advice, and insights.
With the sunset of Universal Analytics (UA) and the release of Google Analytics 4, businesses are in a unique position to reinvent their approach to analytics and measurement.
As we become increasingly reliant on data to drive decisions, optimize campaigns, and enhance customer experiences, it is critical to refine data collection practices and develop comprehensive measurement strategies. These strategies should capture relevant data and provide actionable insights.
If you missed the live webinar, watch the recording below. We’ve also included a recap of Jill and Dana’s conversation, advice, and insights.
Key takeaways
- A measurement strategy is critical: It provides a clear direction for data collection, analysis, and reporting, and ensures all efforts are aligned with business goals and objectives.
- Use scope surveys:
- They help you gather diverse insights from across the organization and help inform measurement objectives.
- Broad participation in scope surveys promotes organization-wide data literacy and ownership.
Include questions on analytics tools confidence, data usage, data trust issues, and key metrics importance. - Analytics plan refinement: Use survey insights to align data efforts with business objectives and pinpoint relevant KPIs.
- Event mapping: Map website events to business objectives for meaningful tracking and analysis.
- Consent is key: Ensure new data collection practices comply with consent and privacy regulations.
- Leverage GA4: If you use GA4 for analytics, take advantage of advanced features like GA4’s path analysis, audience segmentation for deeper insights, effective data visualization tools, and visualizations like scatter plots to make data insights accessible and actionable.
- Focus on actionable insights: The aim is to transform data into insights that drive informed decision-making and strategy improvements.
- Rinse and repeat: Regularly update the measurement strategy to reflect new data, trends, and business goals.
Tune into our next webinar!
Why having a measurement strategy matters
Why is having a measurement strategy so important? There is a lot of data out there, but how do you know what matters to your business? And what do you do with the data once you have it?
As Jill Quick says “Does [the report] make us work smarter? Does it help you understand the data story? How do we get the value out of the data we’re collecting?”
Having a well-defined measurement strategy helps validate marketing efforts, spark new ideas, and enhance data quality. It also helps you know what data to collect, and what to do with that information. Measurement strategies offer a clear direction for data collection, analysis, and reporting, ensuring that all efforts are aligned with your organization’s goals and objectives.
The starting point: Scope surveys
A critical first step in developing a measurement strategy is conducting scope surveys. Scope surveys are a list of questions to help you identify key data points that are most relevant to different stakeholders. We do not recommend skipping this step—these surveys are instrumental in helping you understand and validate measurement objectives.
“I ask my clients to send [the scope survey] to anybody that is impacted by data,” says Jill. “That sees this survey sent to sales, business development, agencies, contractors, sometimes the finance teams because they want to know what’s going on and where the data is coming from, CRO teams, usability, that kind of thing. Now the reason why I suggest it’s broader in terms of the people that get the scope surveys is because it opens up the ownership of data across a company […] and actually, if more people were invested in the data collection, we also can sometimes spread the budget if you know that it’s not just marketing that might benefit from this data collection and visualization. […]. And you only get that if you widen the scope of who gets to see these particular survey questions.”
Now that you know how valuable it is to send scope surveys, how do you know what questions to ask? Jill and Dana share the questions they include in their surveys.
Key questions to include in scope surveys
When designing scope surveys, it’s crucial to ask the right questions. Some of the most impactful topics and questions include:
#1. What is your confidence and understanding of GA4?
Assessing the respondents’ confidence, knowledge and familiarity with analytics platforms (ie. Google Analytics 4) helps tailor your communication with the client and training efforts.
#2. Do you use the data?
Understanding how data is currently utilized within the organization can reveal gaps and opportunities for improvement.
“Making a report actionable is one of the most difficult things that you can do in your career,” says Dana. “And it’s something that is almost like the Holy Grail of marketing, reporting, and analytics. It’s like, how do I actually take this report and make it actionable? You know, I’m not just reporting on sessions by channel, which everybody loves, but what does this data actually mean? And that’s really hard to do. It isn’t just, there’s not just one trick that can apply to every industry. It really has to apply to your own specific situation. I think that that’s where people really get hung up. It’s hard. So if you’re struggling with it, it’s not just you.”
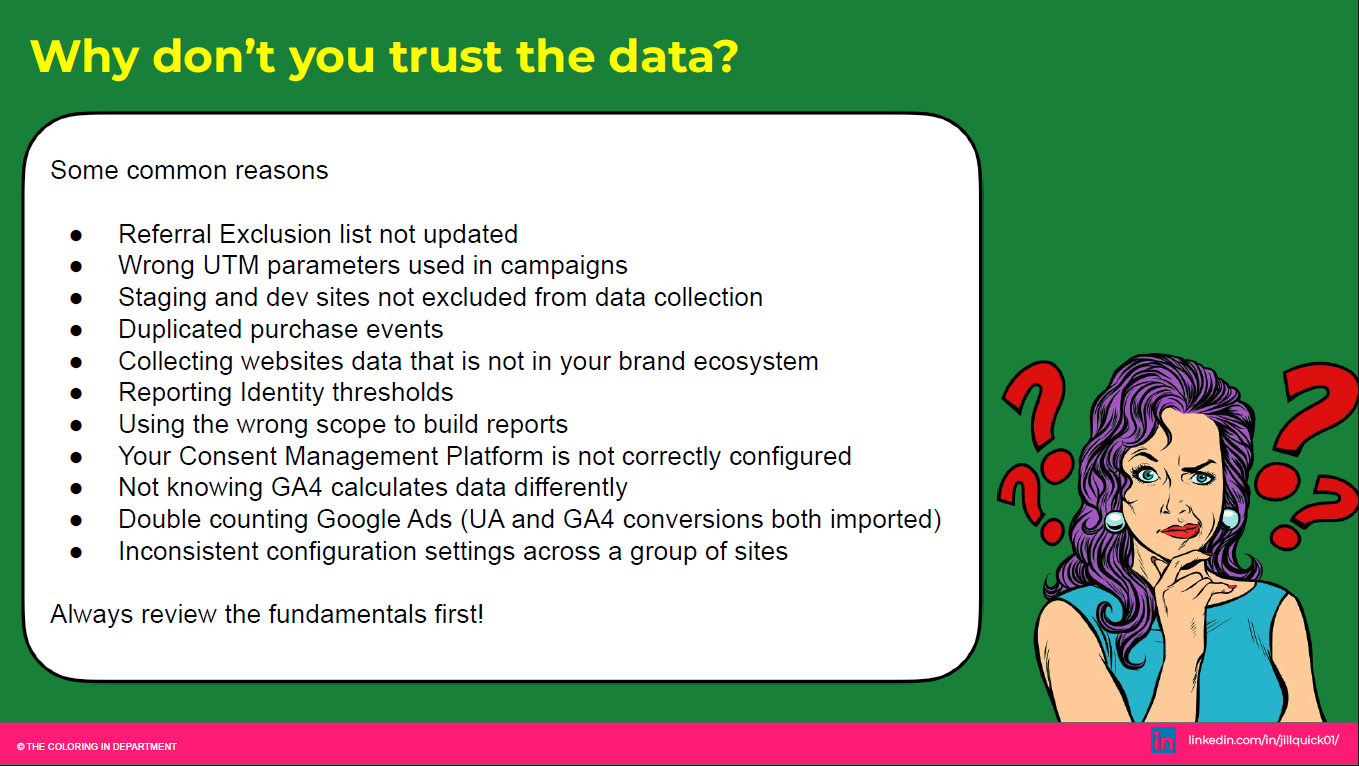
#3. What data do you not trust? Why don’t you trust it?
Identifying any concerns regarding the accuracy or reliability of data can help address these issues proactively. Jill has a checklist of fundamentals that she always refers to when people are feeling uncomfortable with their data. Often, the reason is due to something on this checklist.
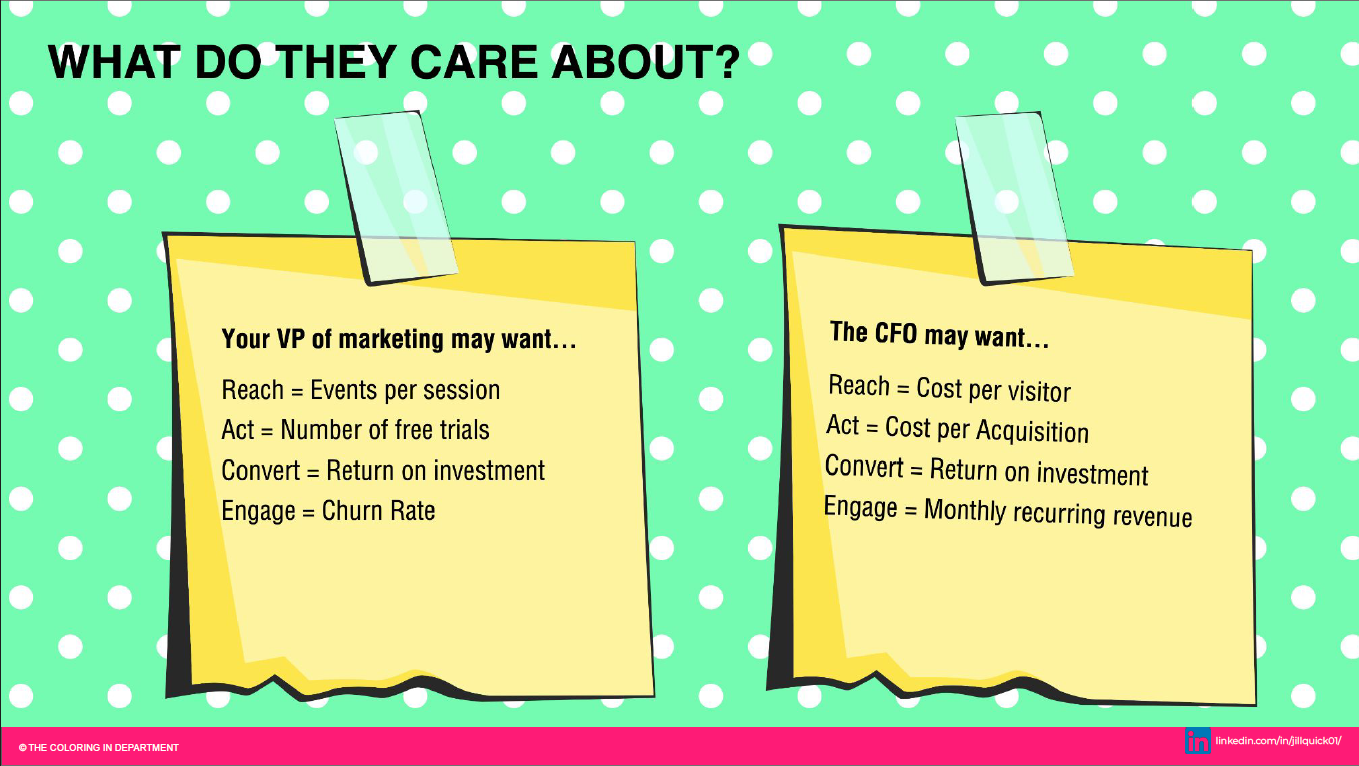
#4. What metrics do you truly care about?
Knowing which metrics are most valued by different stakeholders enables the creation of more relevant and focused reports. Jill says she asks what are the most and least important metrics that someone tracks, to try and understand what data her clients have in hand and if they are getting the right data. It can also help you understand if your client’s data is being visualized in a way that is actually going to help them understand the data. “Are you getting the data that you need so you can show that the work you’re doing is bringing value?” says Jill.
Once you have that information, you can build reports that are simply the metrics your client is getting asked about, instead of a data-heavy report that is hard to decipher. Making the process as pain-free as possible can help highlight your client’s performance.
Jill recommends doing Post-it Note Reporting – what does the person looking at the report care about? What do people need to know in their specific roles and which performance metrics best represent that information?
Once you have a better understanding of what metrics matter and what people want on their Post-it Note reporting, do not go straight into your tool of choice and build that dashboard. Start with creating a wireframe for your reports before you build them out. This will help prevent a ton of edits, and give you a better opportunity to think about how you can best visualize the data to tell that story.
This will prevent you from wasting time and help make the build go faster because you are starting from a blank page, you are looking for the dimensions and metrics and you can whip that report up really, really quickly.
#5. What questions about the work you are responsible for that you would really like to answer?
If you know more about GA4, then this question is really helpful for you to get a better grasp on what people care about and if they have the data readily available. Here are some real-life examples of questions Jill has had from clients and how you can use GA4 to answer them:
“How long does it take people to convert?”
You can build a funnel in GA4, turn on Show Elapsed Time feature (a new feature to GA4 that was not available in UA), and it will tell you how long it takes people to go through the steps and convert.
“I really want to know more about the customer journey and where people get stuck.”
Path Analysis in Explorations allows you to click on a “start over” button and select an “Ending Point” which can be a page, campaign, an event, a conversion, and then you can look at all the events that led up to that or all the pages that led to that. This takes the guesswork out of wondering what people are doing on the website. This shows you the flow of what’s happening.
“I want to prove our SEO is helping the bottom line. I know in my gut that it is, I just can’t prove it!”
You can use audiences as segments. In this case an audience was built in GA4 for users that landed on a page that contained a keyword on the page that was optimized for SEO and then within 30 minutes made a purchase. Then they created the opposite audience segment for people who did not see the content and after 30 minutes made a purchase. The results showed that for the people (audience) that did see the optimized SEO content, they spent more money and added an extra product to their baskets.
“I want to know where our best customers are, who spend frequently and above our Average Order Value (AOV)!”
Build an audience based on people that purchase more than the AOV amount. In GA4 you can look at your Traffic acquisition report and add a dimension based on the Audience you created and you can see where they are coming from and even take it to the page view and events level.
“I want ideas for what is trending, what to put in my marketing communications!”
Reduce your cognitive load and try using scatter plots to draw insights from, because looking at rows and rows of data can make it really hard to see trends.
Need help crafting a measurement strategy?
Refining your measurement plan through event mapping
With insights from the scope surveys in hand, the next step is to refine your measurement plan. This involves aligning your data collection and analysis efforts with the broader business objectives (what are your goals?).
“If you can’t draw your business on a piece of paper, you do not know it well enough and you need to go away and find out how it works.”
Alistair Croll, Co-Author of Lean Analytics.
Based on the business model of the company you’re building a measurement strategy for, go look at their website and evaluate:
- What is in my control in terms of what data I can collect, and
- What matters to this business?
Map the conversion points
Once you’ve refined the business goals and you know what data you can collect, you map those to micro and macro points. Here is how it ends up looking as a kind of baseline:
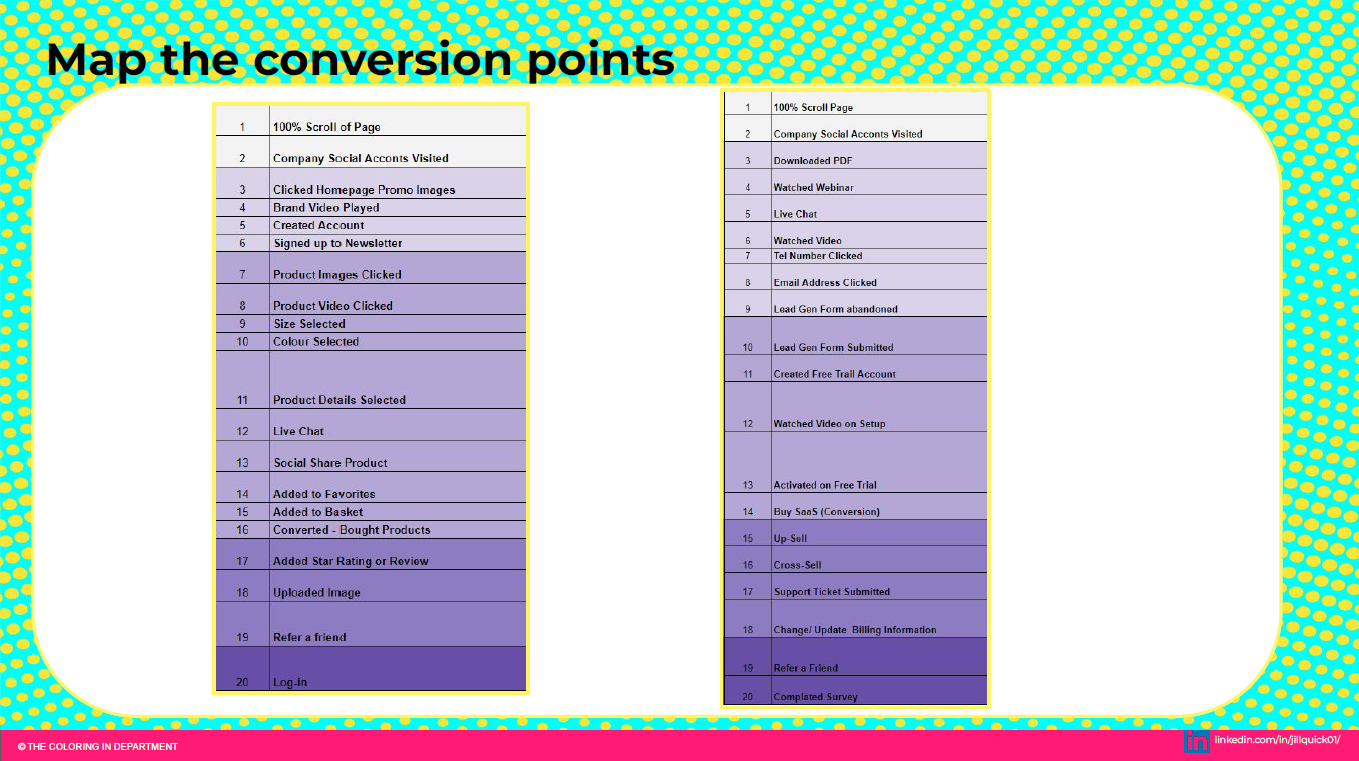
The left is e-commerce, the right is SaaS: this is a technique Jill uses from Lean Analytics by Alistair Croll to identify the key points and areas that align with the customer journey to get your customer to take the action you want them to complete on the website. She then uses a process called event mapping:
- Work out what your clients want—what is their wish list of data points? What are the business objectives?
- Go through the website. Start with the home page, and determine what’s happening on this homepage that is linked to those conversion points that we’ve looked at earlier.
- Determine if you need to track telephone numbers, email addresses, videos, and anything being downloaded on the homepage.
- Next,go to the money pages, which is basically where you want a visitor to do things on this page — so it’s either they buy something or fill out a form.
Once you’ve gone through that process, which can take anywhere between 8 to 20 hours, depending on the size of the website, you map it all out. Top to bottom, the customer journey — what’s the objective of the event? Is it an auto enhanced, recommended or custom event?
“Gentle reminder for that if you’re going to suggest a new event to track that you need to get permission for it. It might have something to do with consent mode or you might need to update your privacy policy. We shouldn’t just be tracking things for the sake of it. And we absolutely need to get consent for those data points as well.”
Jill Quick
Continuous evaluation and adaptation
Finally, it’s important to recognize that a measurement strategy is not a set-it-and-forget-it endeavor. As your business evolves, so too should your measurement strategy. Committing to continuous evaluation, you can develop a strategy that not only meets your current needs but also adapts to future challenges and opportunities. Remember, the goal is to transform data into actionable insights that drive informed decision-making and sustainable growth.
“I would say that [with using scope surveys] my measurement strategy is faster. I don’t get lost down rabbit holes. I can find fixes faster. Ultimately, the people who have brought me in to do this work have said ‘Wow, you’ve given me something that is actually useful’. And dare I say, some people actually love analytics a bit more because they didn’t know you could do all these things.” Jill Quick
Too busy to build your own analytics templates, reports, and frameworks?

Jessie Low is the Marketing Manager and Course Consultant at Analytics Playbook. She has over 13 years of experience in the digital marketing industry. She loves working with businesses to develop SEO and content strategies that help grow their online visibility. From running a digital conference to product and service development, she’s dabbled in it all.
Learn more about Jessie