
GA4, your email service provider, and social platforms like LinkedIn all provide you with data about the performance of your content; with AI, you have a powerful data analyst that can work at record speed. Knowing how to use your data and AI together can offer next level insights — but AI is only as good as the prompts you provide it and processes you have in place to draw this information out. In our latest webinar, Dana spoke with Andy Crestodina, Co-Found and CMO at Orbit Media, about AI-Powered Data Analysis.
If you missed the live webinar, you can watch the recording below and read the recap to get Andy’s step-by-step processes and learn how to start using AI with your own data.
Get marketing data analysis help from AI!
It’s pretty common for marketers and SEOs to use ChatGPT (this is the tool used during the webinar) or other AI Tools to edit content, brainstorm topics, provide recommendations or even write a blog post. But Andy believes the real magic happens when you turn your AI tool into a marketing data analyst. Once you do that, you’re essentially learning to talk to your data.
“My general thesis in life is that reporting is not that useful in marketing. Reports themselves don’t affect outcomes. The best GA4 users are good at not just reports, but analysis… anybody can use AI to brainstorm topics and just suggest 10 article ideas or whatever, but the best AI users go one step farther and use it for actual impact, like to suggest the changes or to create the draft and to go a little bit farther with it.” Andy Crestodina
Data management & privacy
⚠️ Before you start uploading data to any AI-powered tool you need to be responsible and check your internal policies and legal agreements to ensure you are not violating your company’s protocols and procedures. Never upload any data that is not yours or that you don’t have permission to use, or any Personally Identifiable Information (PII).
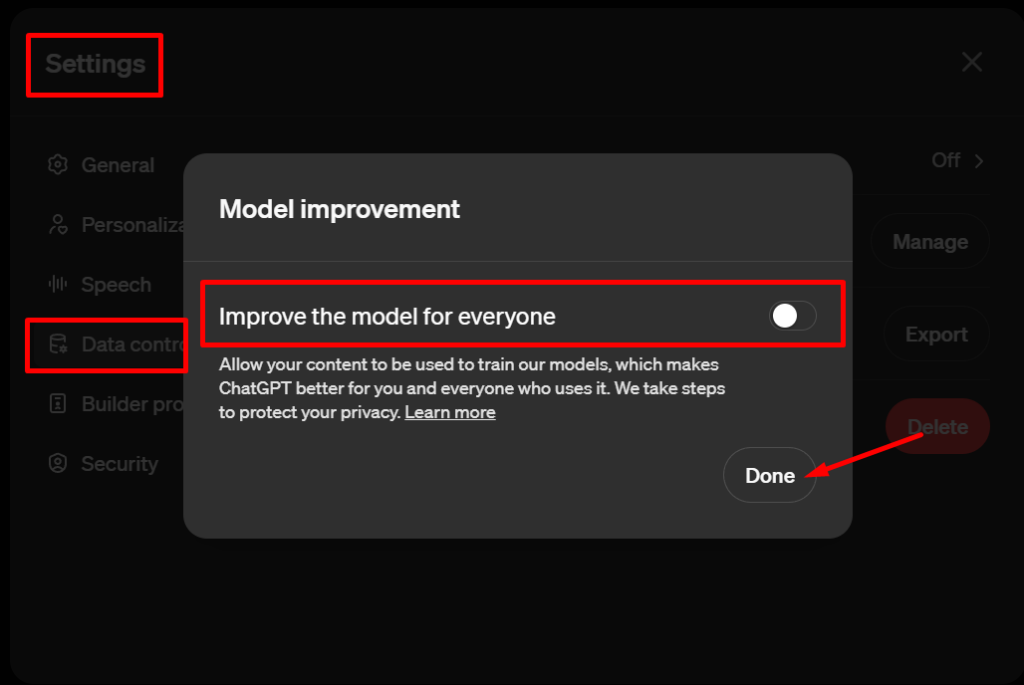
A lot of people are worried that the data they upload to ChatGPT will be used to train Version 5, but in the pro version you can disable chat history and model training. Here is how you can turn off training in ChatGPT (H/T to Andy Simpson):
- Navigate to ChatGPT
- Click “Settings”
- Go to “Data Controls”
- Click on “Improve the model for everyone”
- Turn this feature off
- Click “Done”
Make it easy for AI to read your data
Avoid AI struggles by making sure you have clean data. Many of the reports that you will export from GA4 and other data sources will have unnecessary information that, if uploaded, will confuse the tool.
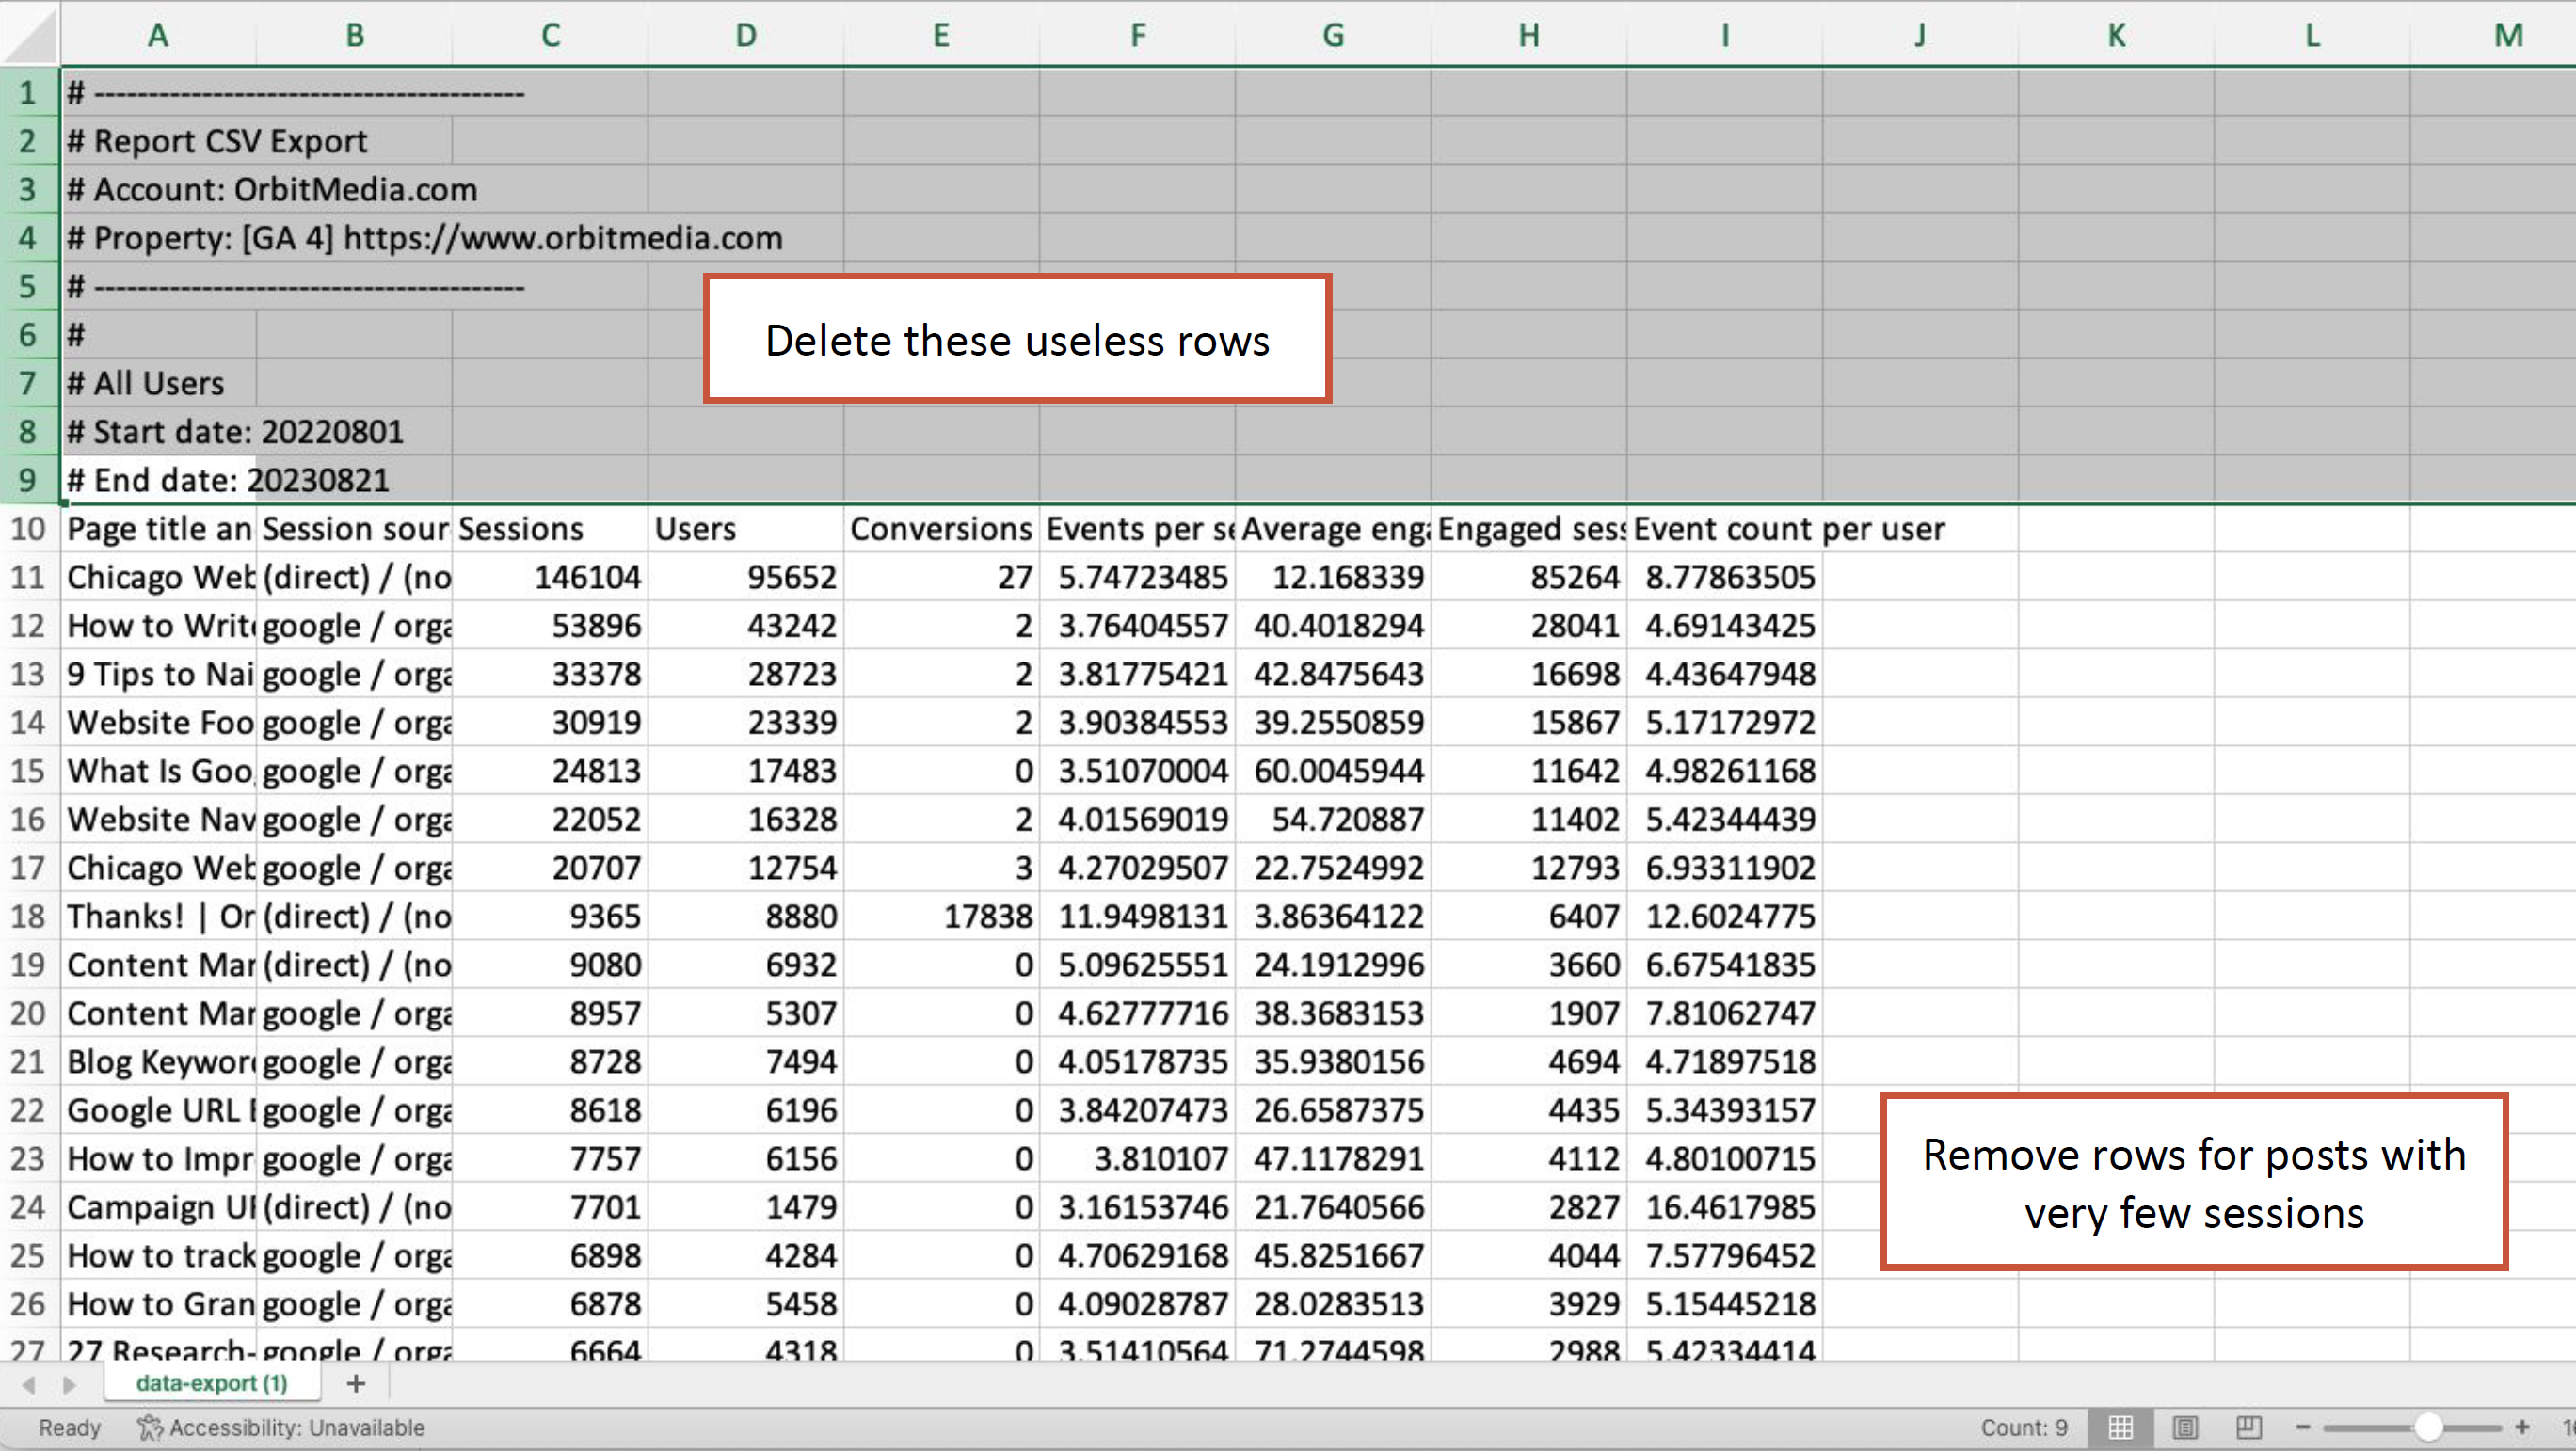
Delete this information before uploading to ChatGPT. If you want to use your AI-tool to assist with cleaning up your data, here are some additional clean-up prompts Andy recommends:
- Remove all rows with fewer than [X users/sessions] users from the dataset.
- Remove [Brand] from the title tags in this dataset.
- Remove all rows from the dataset if the language in the first column is not English.
- Merge repetitive entries.
🔔 Reminder: When you are completing a specific analysis you going to be asking a series of prompts in the same chat. Start a new chat only if you are uploading an unrelated dataset or want to do a new/different analysis.
Identifying gaps in a content strategy using GA4 data
A common and important question a lot of marketers want an answer to is: which topics are missing from my blog? You can use your existing GA4 data and AI to find this out by exporting articles, headlines, or title tags from GA4 to see what AI suggests.
How to perform a GA4 content analysis using ChatGPT:
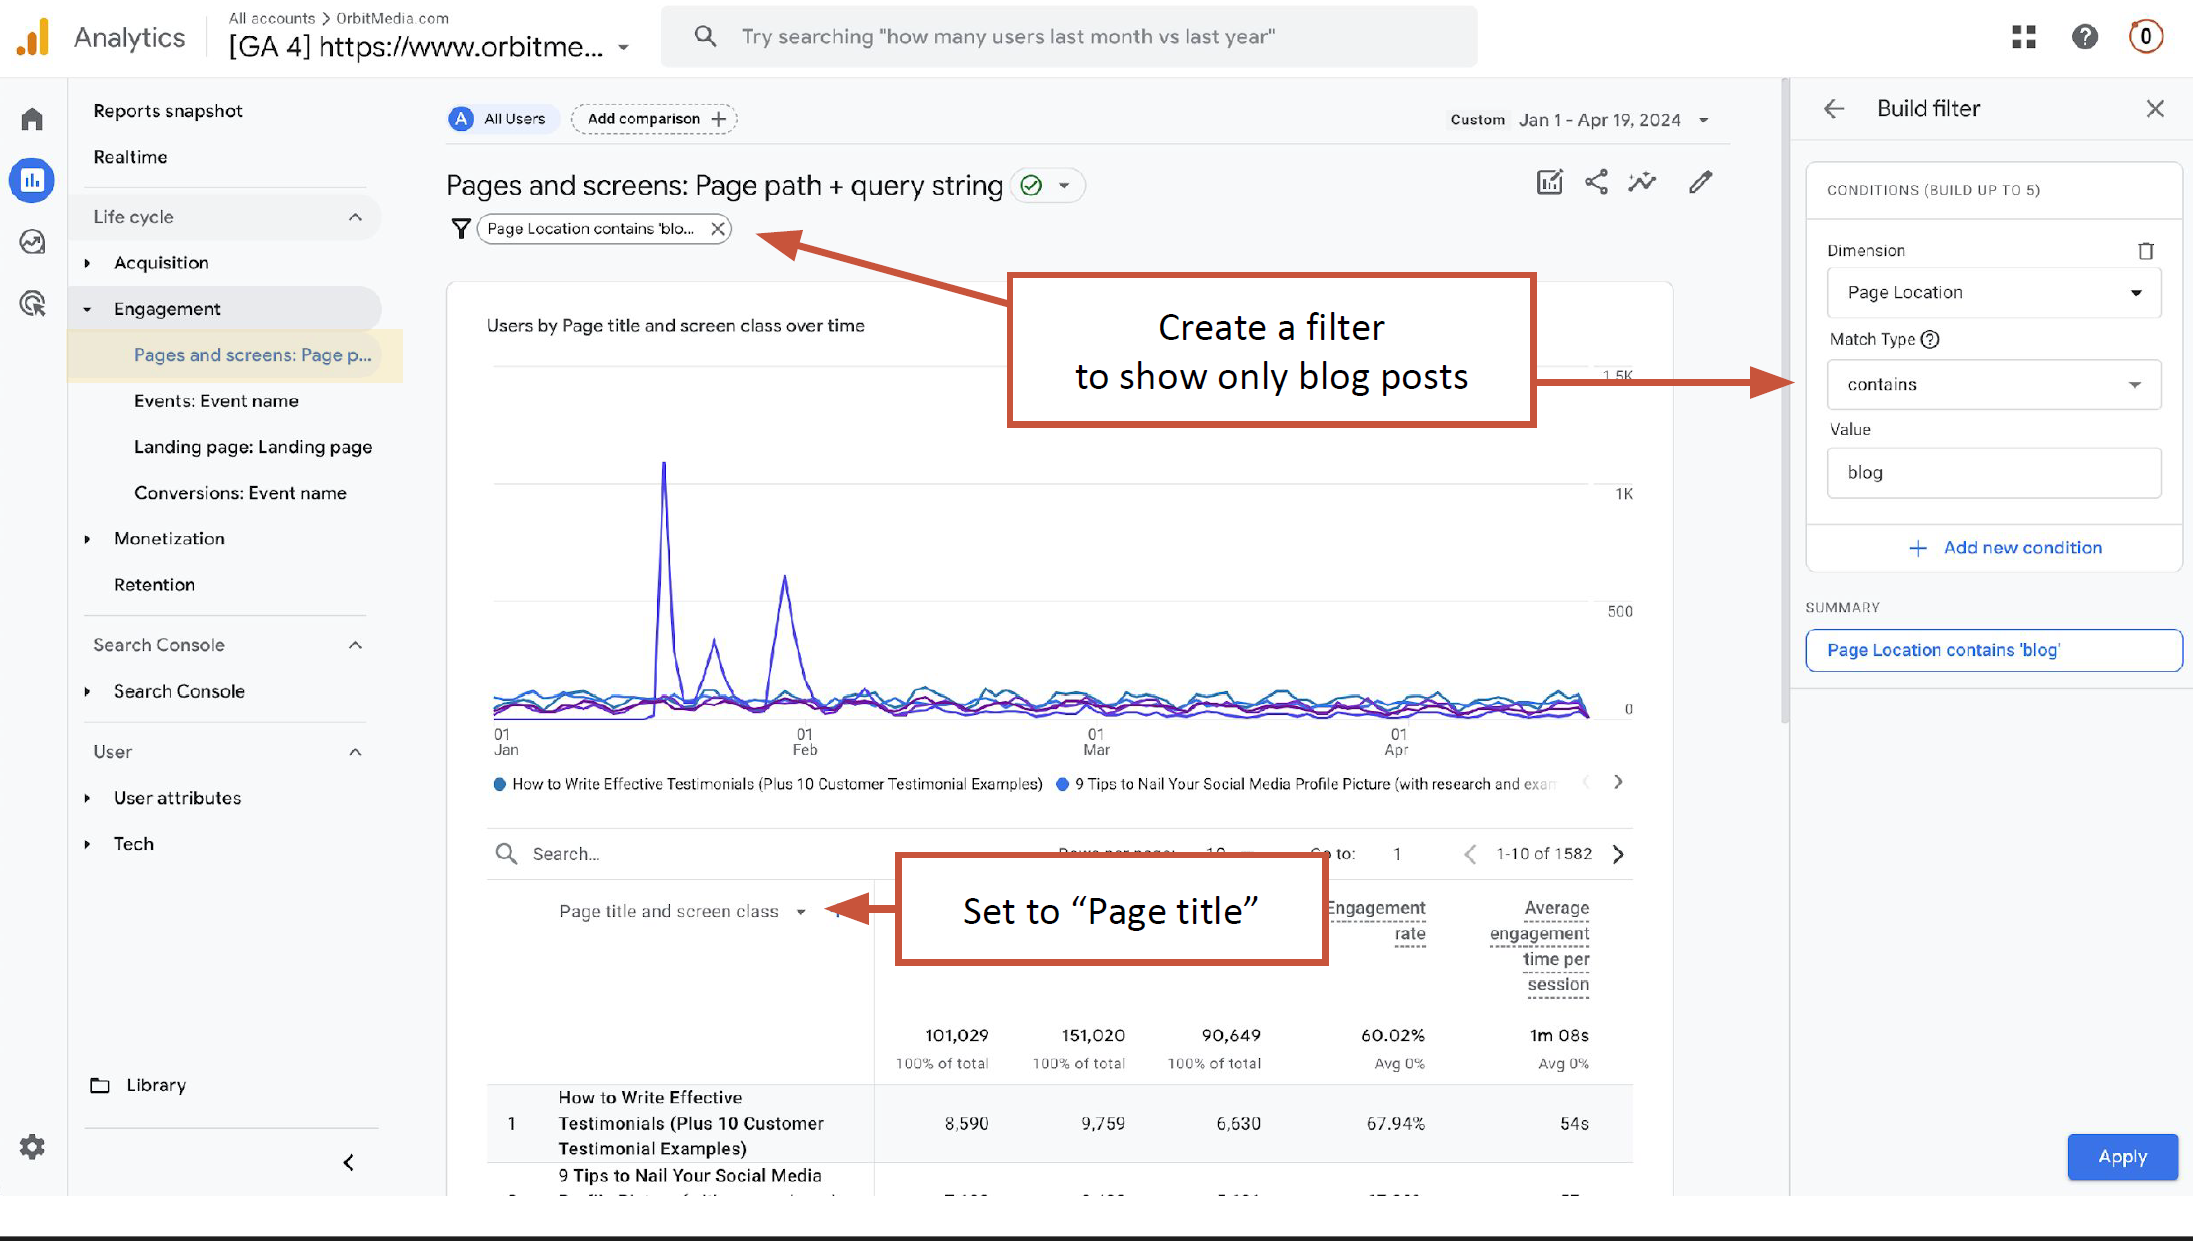
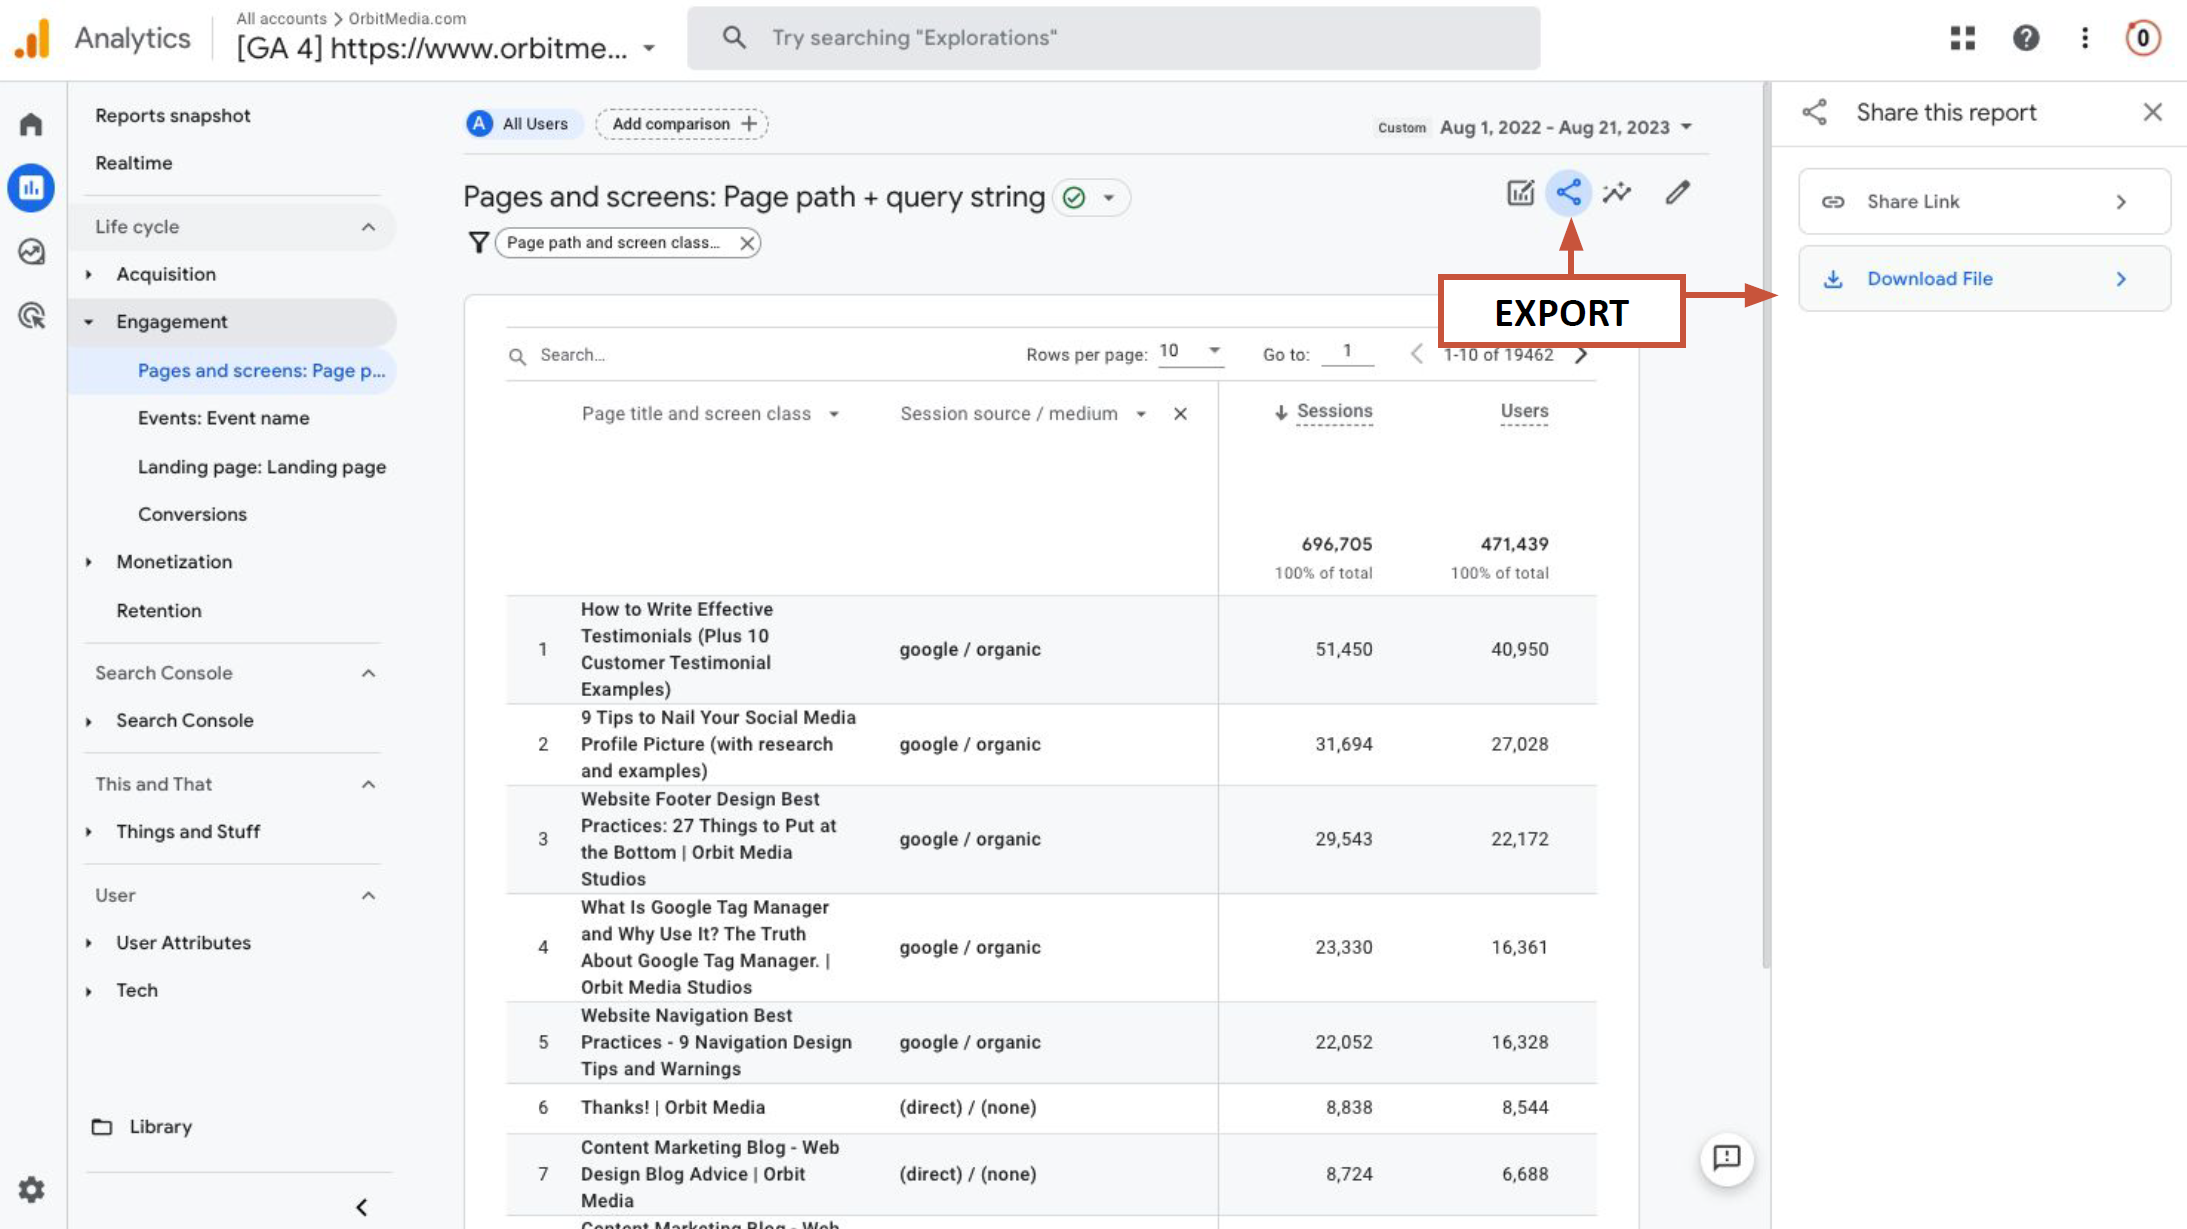
#1. Export your Pages & Screens Report from GA4.
- Go to “Reports” > Life Cycle > click “Engagement”
- Select “Pages and screens”
- Choose your analysis time frame
- Set the Primary Dimension to “Page Title”
- Create a filter to show only blog posts
- Dimension = “Page_Location”
- Match Type = “contains”
- Value = “blog”
- Export the CSV
#2. Upload the CSV to ChatGPT (make sure your data is clean)
#3. Enter Prompt 1:
“You are a digital marketing analyst and an expert at using Google Analytics data to inform decisions about content strategy.
I’m giving you the data from a GA4 report showing performance of content on a blog. This report shows the title tags and the performance of each article.
Infer topics from the titles of the articles. Ignore the brand name (“[Insert Your Brand Name]”) and ignore all non-English title tags.
Identify gaps in this content strategy using semantic distance analysis. Suggest topics and articles that would likely have high traffic and engagement rates.”
#4. Enter Prompt 2:
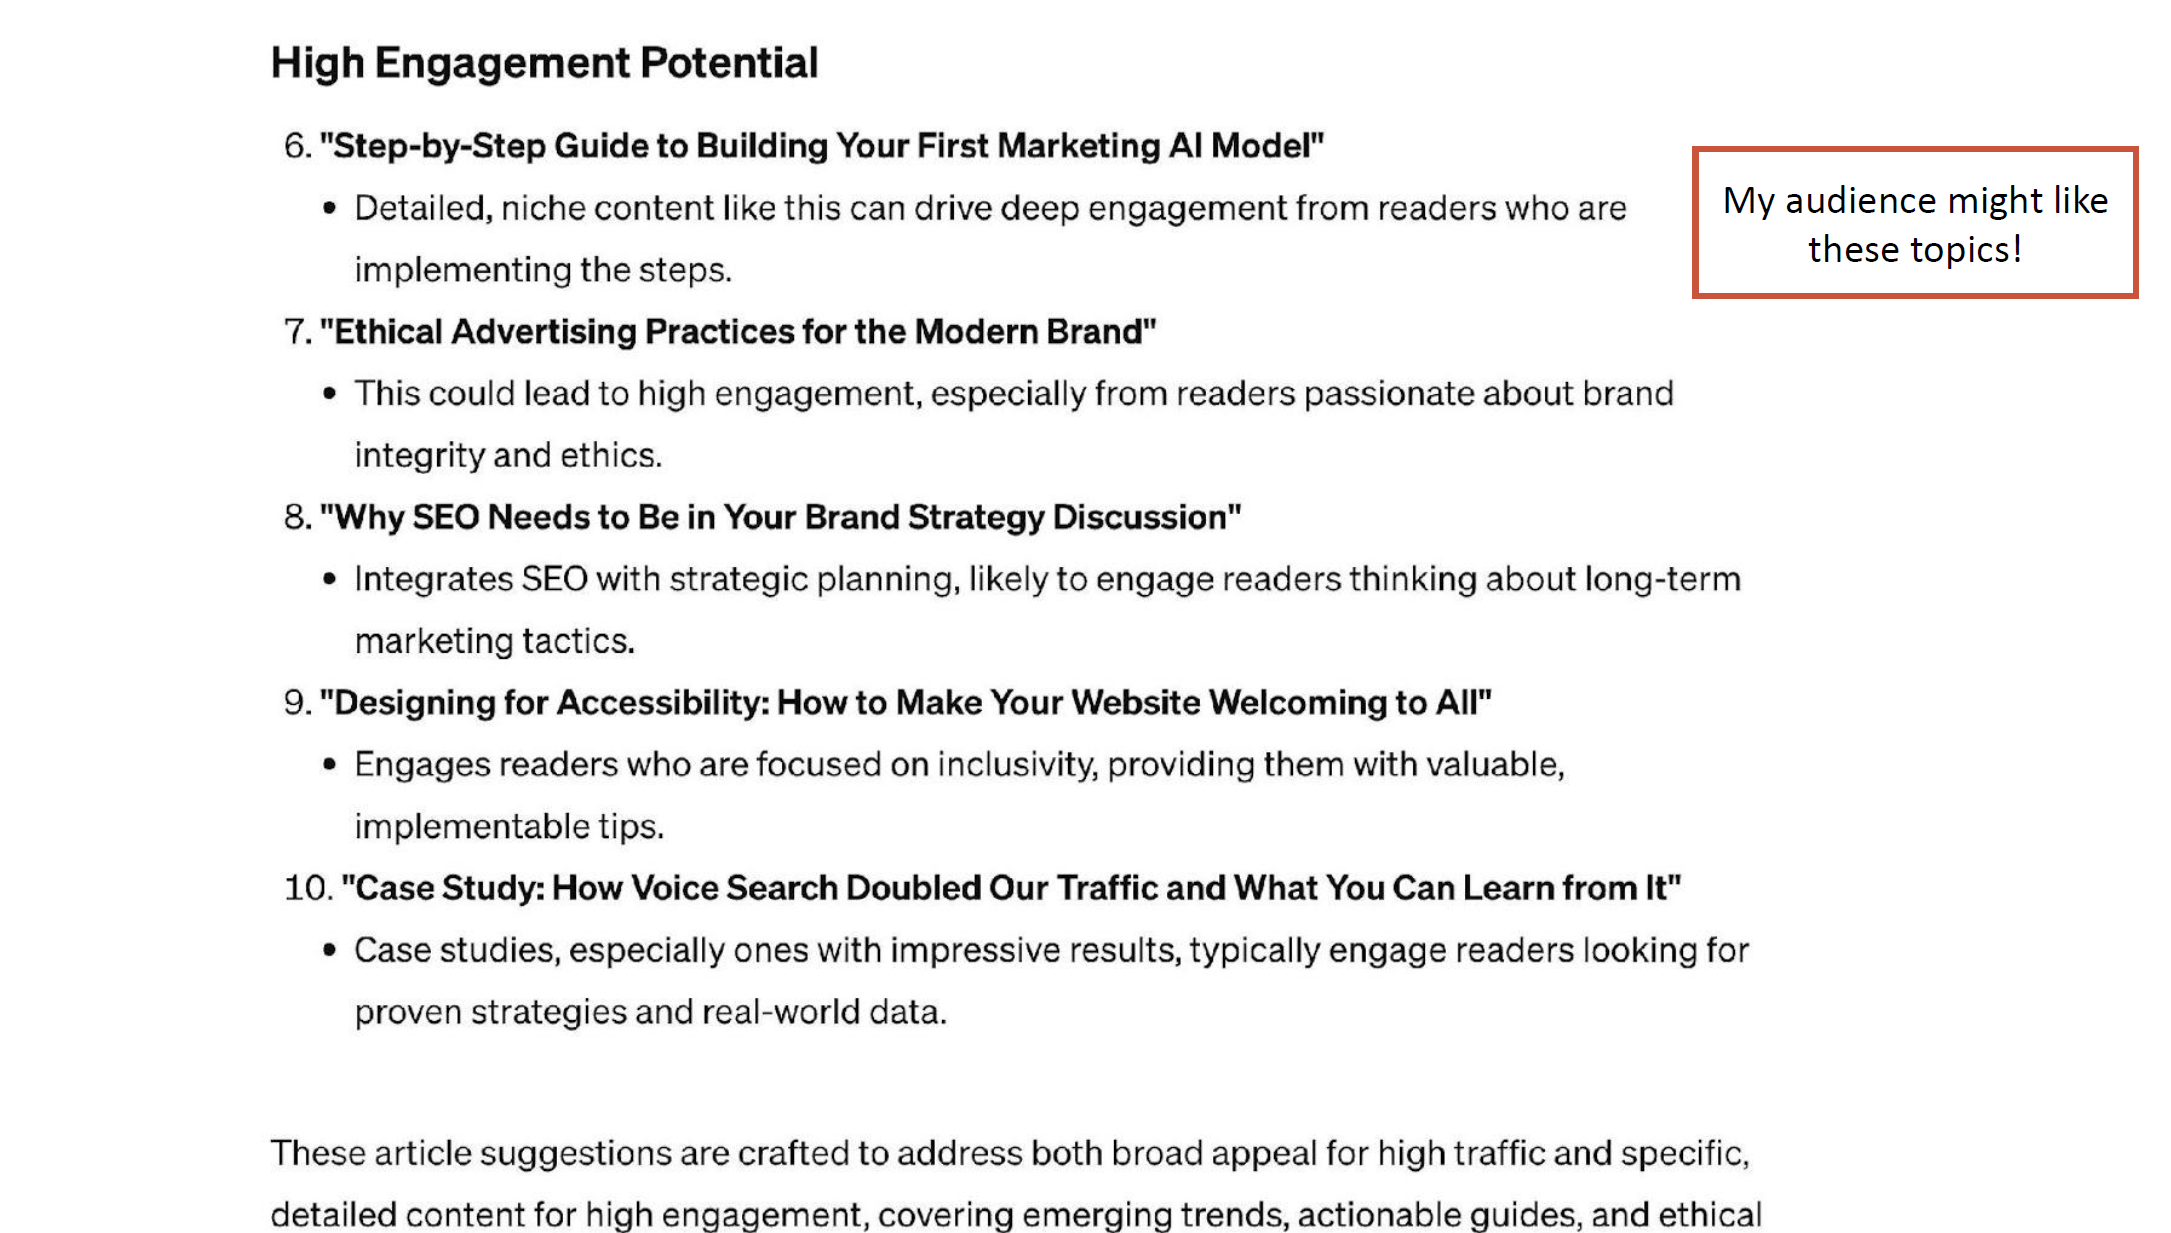
“Recommend 10 article headlines that would fill the content gaps.
Indicate which articles would likely have high traffic and which would have high engagement.”
Audience question: Does AI hallucinate less when you provide your own data until your prompts start to veer away from the data you’re referencing?
“I’ve seen inaccuracies, but I don’t know that I would consider them hallucinations… I’m looking for clues. It’s my same perspective with just using GA more broadly. If my goal here is to get feedback on my content strategy, I think I can do that without concerns about bias, accuracy, hallucinations, and such… I joke sometimes AI should stand for just assuming incorrect, not going to be correct. You have to test and watch and verify. Always verify. Don’t trust AI.” Andy Crestodina
Learn how to use GA4, so you can pull all your data easily for AI analysis
Getting channel-specific recommendations for your content using GA4 data
Social and search are different! What you bring to each should be different. Which topics should you be publishing on your different channels?
“Topic Channel Fit. I’m obsessed with this. Some topics work better in some channels. Some topics will fail in certain channels, right? Search versus social. Visitors from search are busy, visitors from social are bored, right? So there is such a thing, absolutely, as topic channel.” Andy Crestodina
How to perform a topic channel analysis for search vs social using GA4 data
#1. Export your Pages & Screens Report from GA4.
- Go to “Reports” > Life Cycle > click “Engagement”
- Select “Pages and screens”
- Set the Primary dimension to “Page Title”
- Click the pencil icon to “Customize the report”
- Here you want to add metrics that relate to content performance
- Sessions
- Users
- Key Events (formerly known as Conversions
- Average engagement time per session
- Engaged sessions
- Average session duration
- Add a Secondary dimension of “Session source/medium”
- Choose a big date range for your time frame (a year plus is ideal)
- Create a filter to show only blog posts
- Dimension = “Page_Location”
- Match Type = “contains”
- Value = “blog”
- Export the CSV
#2. Upload the CSV to ChatGPT (make sure your data is clean)
#3. Enter Prompt 1:
“I’m giving you Google Analytics data about traffic to the [enter your website] blog. Can you analyze?
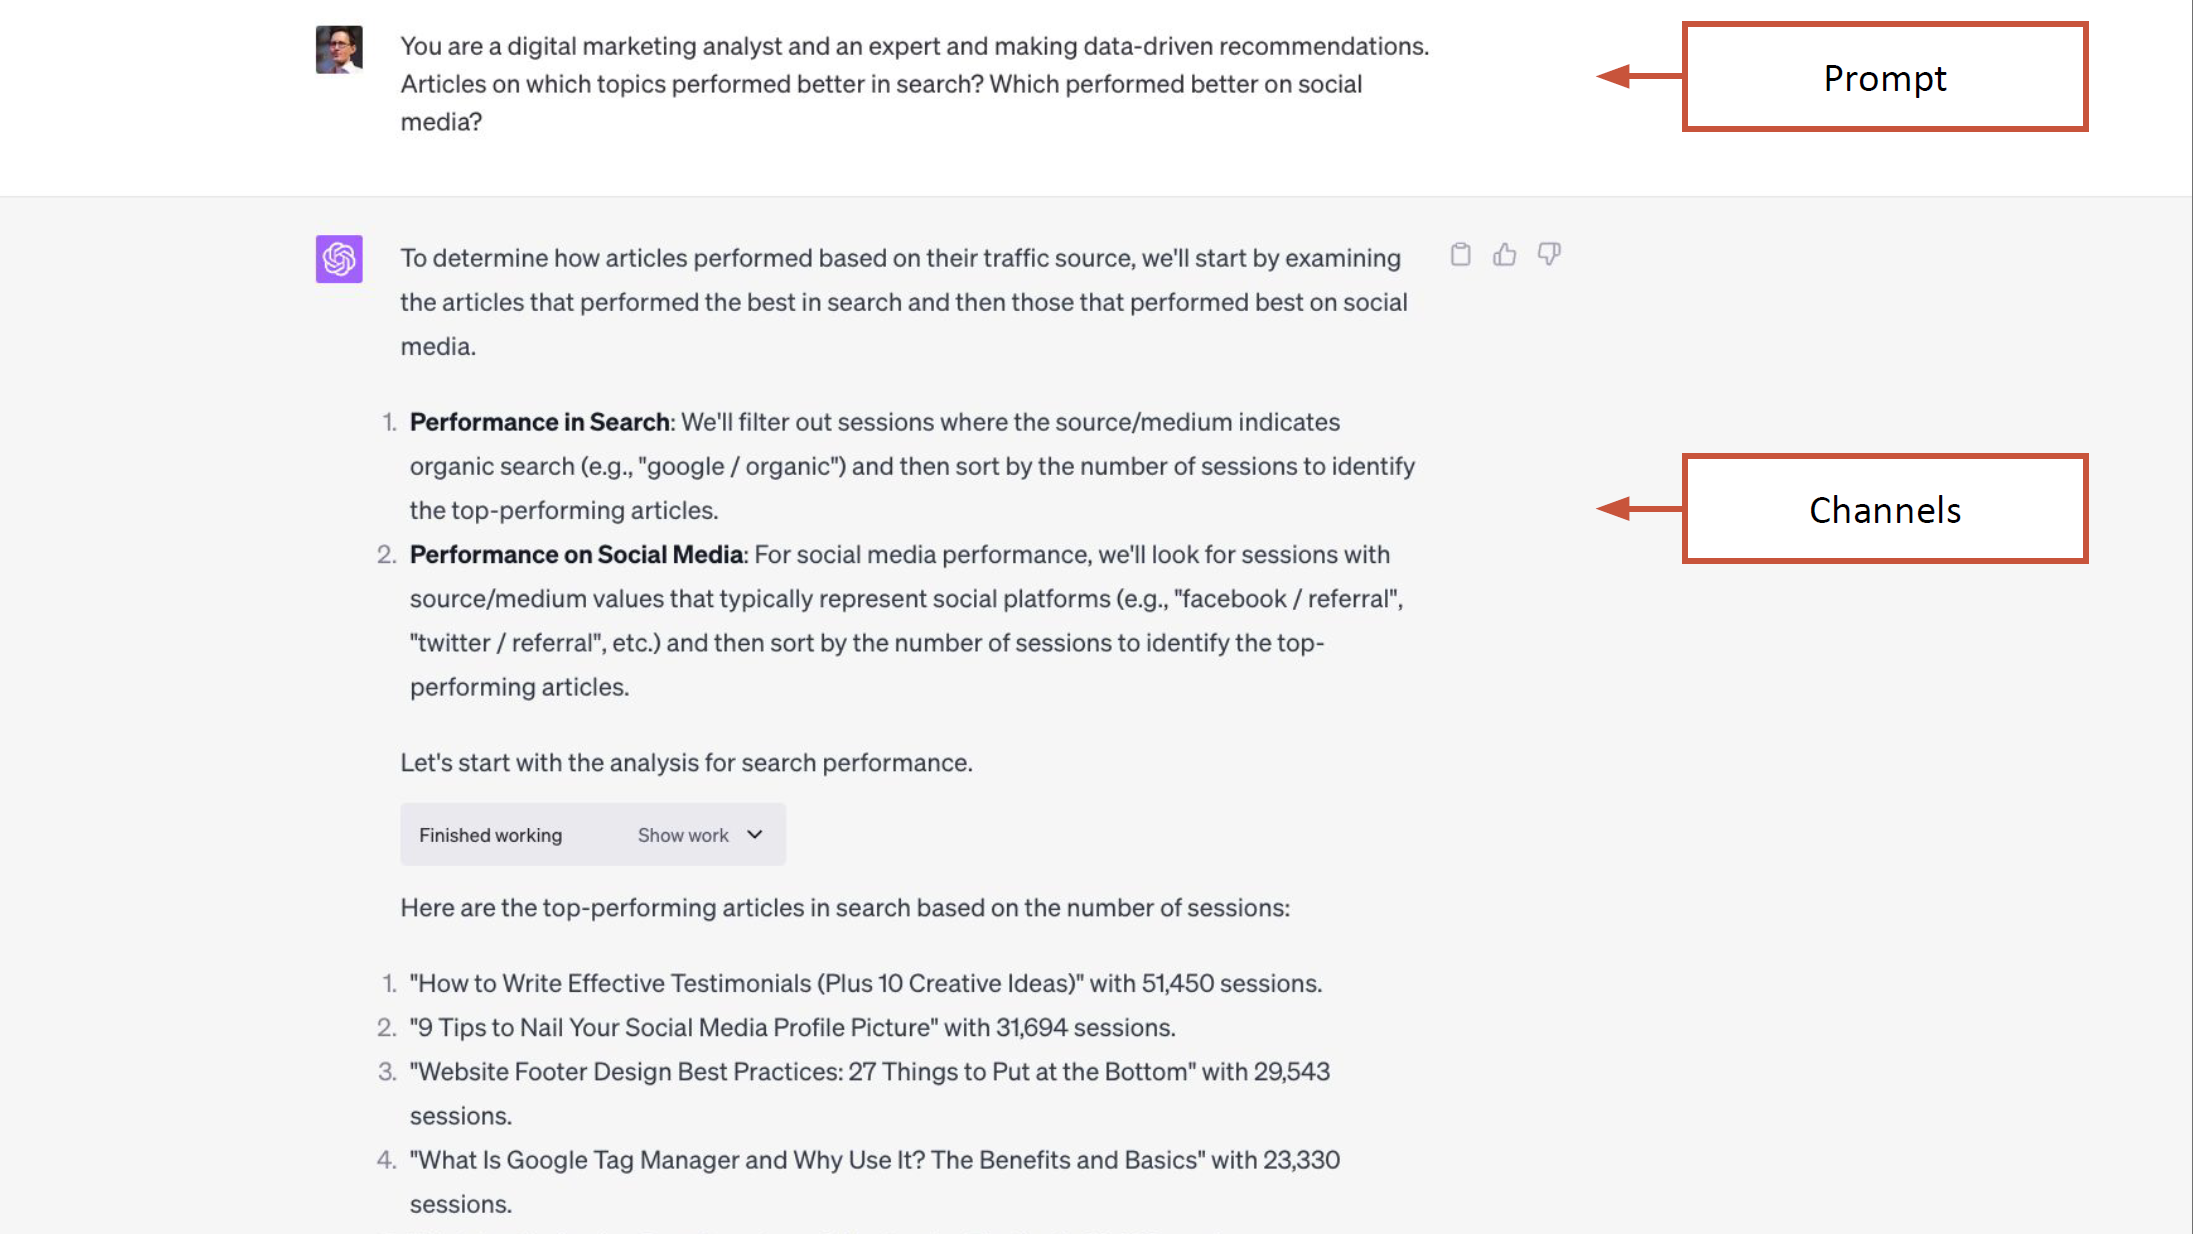
#4. Enter Prompt 2:
“You are a digital marketing analyst and an expert at making data-driven recommendations. Articles on which topic performed better in search? Which performed better on social media?
#5. Enter Prompt 3:
“Divide them into two groups: good for social and good for search.”
#6. Enter Prompt 4:
“What do the titles of the articles with the greatest engagement have in common?
Suggest 10 new topics that share the traits with the most engaging topics in the dataset.
#7. Enter Prompt 5:
“Which of these topics is the most likely to perform well based on its alignment with success traits?”
#8. Enter Prompt 6:
“Write an outline for that article.
The outline should work well for a draft that has 1000+ words, a bulleted list, research and supportive data, many visuals, internal link to relevant articles, contributor quotes from experts, and a highly scannable format with keyword-focused subheadings and short paragraphs.
In the outline suggest places to incorporate those elements.”
Optimizing on-page SEO based on using Google Search Console (GSC) data
If you’re looking to improve the relevance on an existing landing page and want a sustainable way to do good SEO, then this prompt needs to be on your radar. In the webinar, Andy mentioned that this one has worked very well for him! And what better way to perform on-page optimization than using your own data to inform your edits?
How to analyze a landing page for SEO edits
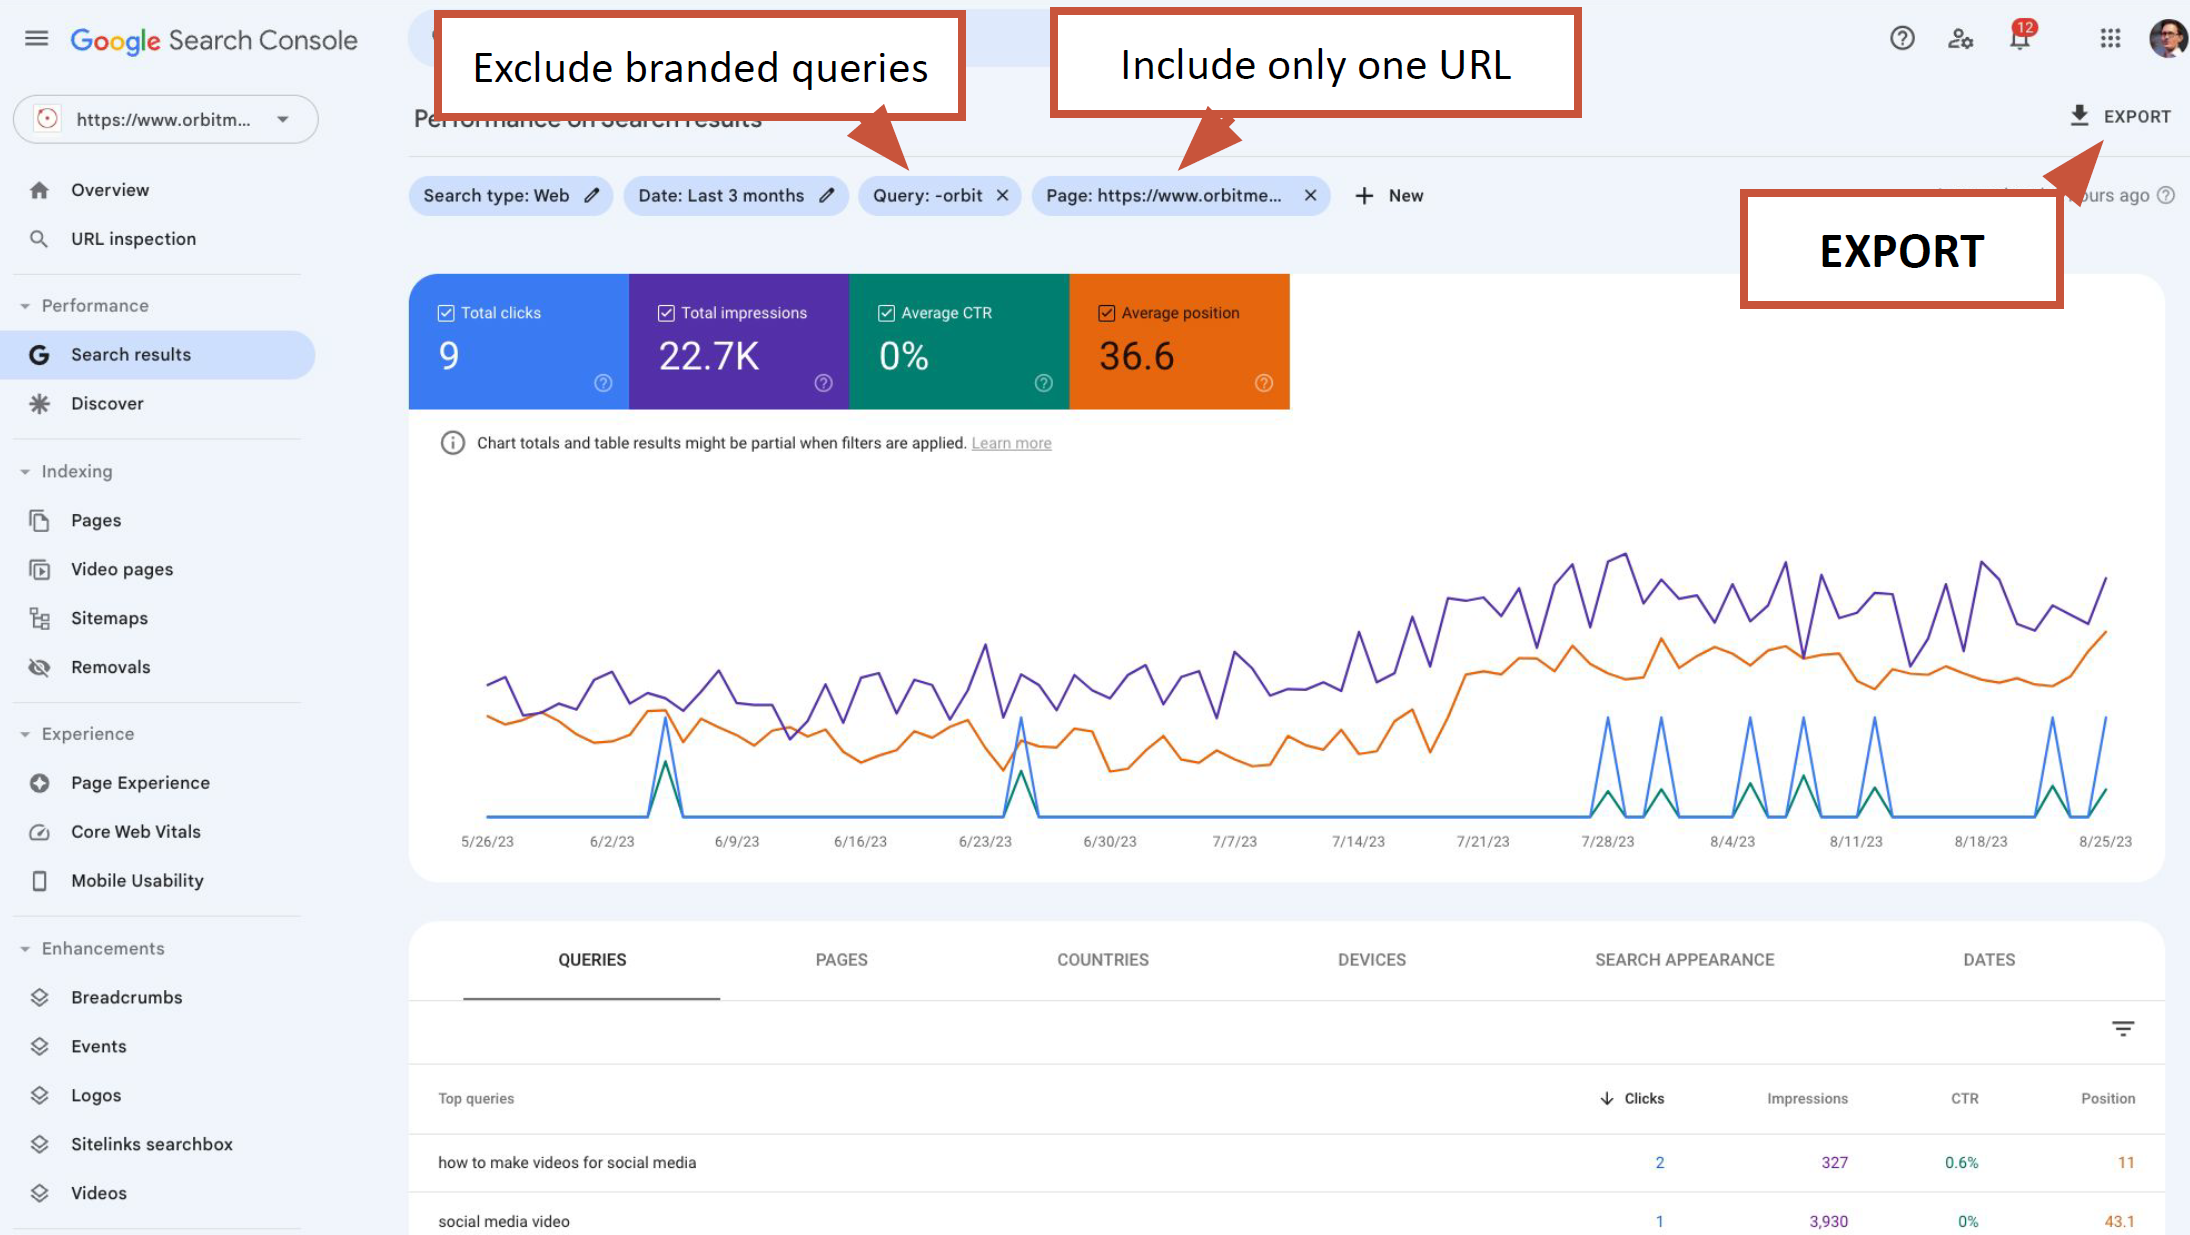
#1. Pull your Google Search Console Pages report:
- Go to Performance and click “Search results”
- Go to Date and click the “Customize report (pencil icon)”
- Change the date range to match your GA4 report and click “Apply”
- Exclude branded queries
- Click the “+ New” filter
- Select “Queries not containing”
- Enter your brand name
- Click the “+ New” then “Page” to add a filter to analyze a specific landing page
- Select “Exact URL” in the dropdown
- Then “Paste the URL” for the landing page
- Click “Apply”
- Click “Export” > Download CSV
- Clean up your CSV file removing the report, account, property, etc, so your AI tool can properly analyze the data.
#2. Upload your GSC report to ChatGPT
#3. Enter Prompt 1:
“I am giving you Google Search Console data showing the search performance of a URL. Can you analyze?
#4. Enter Prompt 2:
“You’re an expert SEO who is highly proficient at keyphrase analysis.
Merge the rows with very similar queries into single rows with a single, representative marketing keyphrase.
As you do so, for each row, combine the data for impressions and clicks and averaging the data for CTR and Avg Position.
Provide a link to download.”
“Whenever you tell AI to clean something up or edit a spreadsheet, it’s just risky to not take this step — provide a link to download, then go look at the file. Click to download it, look at it. I’ve gotten frustrated trying to use AI when I asked it to clean up the data and it took out all but three rows. I can’t do an analysis on an empty spreadsheet here. So provide a link to download and go look at it because it won’t tell you if it removed 99 percent of your data. It’s not that smart.” Andy Crestodina
💡 A useful prompt you should incorporate into your AI methods is: “Do you have any questions for me?” Ask AI if it wants to talk to you and if you can be of assistance with clarifying instructions or provide more information into the data.
#5. Enter Prompt 3:
“Here is the webpage for the data you’ve analyzed
Evaluate this content’s keyphrase usage and frequency for the keyphrases in the dataset.
[Paste in the content of the landing page]”
#6. Enter Prompt 4:
“Suggest edits to this page that would rank higher by better indicating it’s relevance for the keyphrases in the dataset.
Focus on recommendations for including the phrases that are not used on the page but appear in the dataset.
Make suggestions that improve the flow and clarity of the content, as well as keyphrase relevance.
Highlight the recommended changes.”
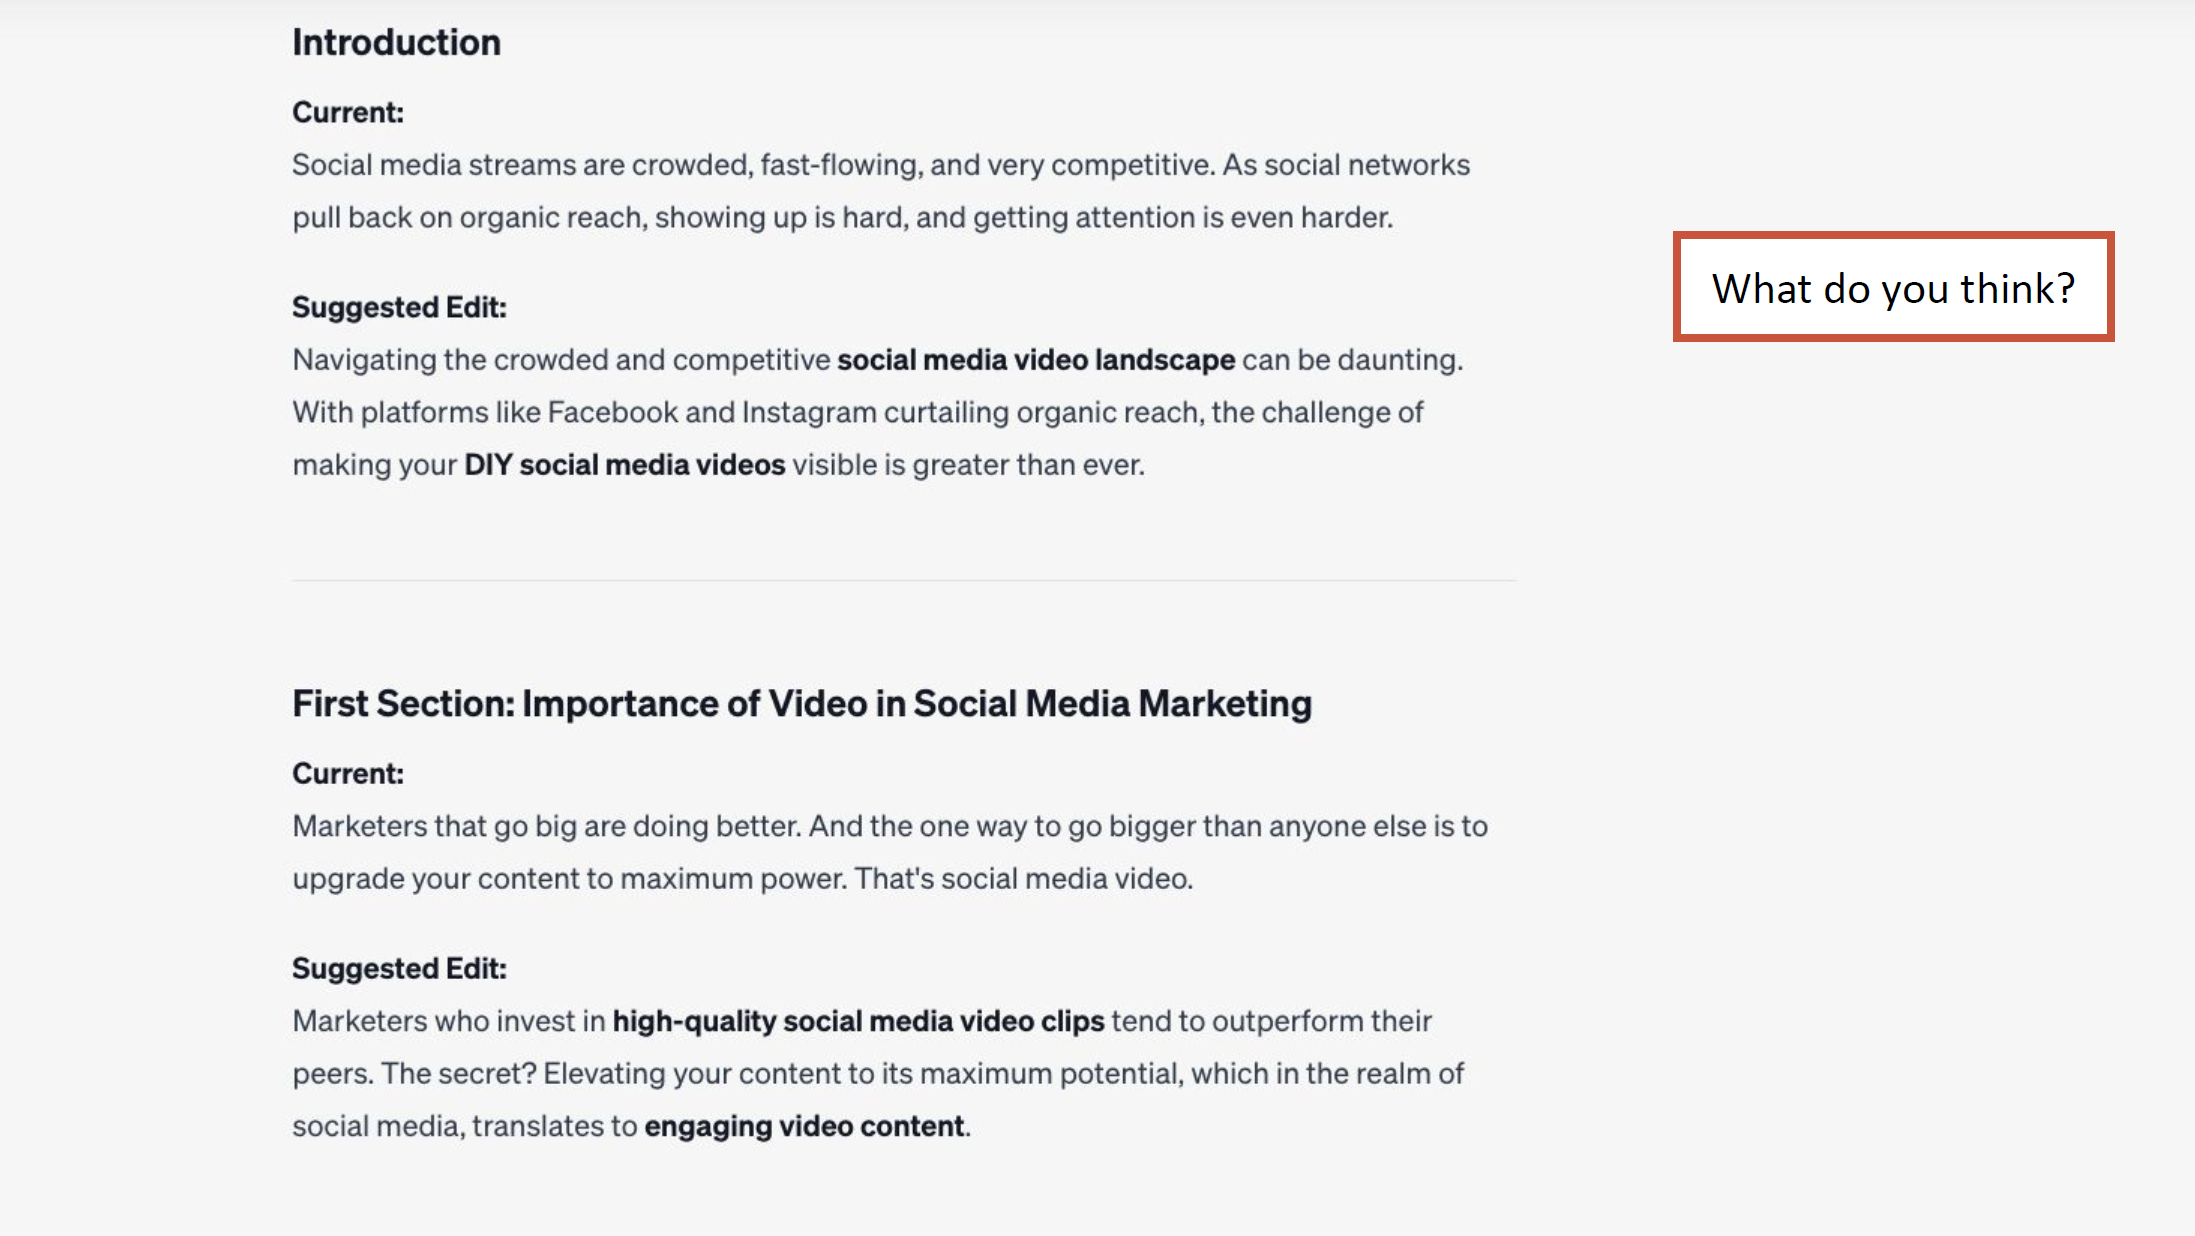
“I’m not a spammer. I am absolutely not a keyword stuffing SEO. I care about my visitor. I’m an empathetic data driven marketer. I honestly think that this is just better copy. You get the idea. Try it for yourself! There’s no downside to updating that.” Andy Crestodina
Find gaps in your content strategy using GA4 and GSC data
What content are you missing or have not written about yet? You can use ChatGPT to get ideas for what to write next so that you can fill in the holes.
How to perform a Semantic distance analysis
#1. Export your Pages & Screens Report from GA4.
- Go to “Reports” > Life Cycle > click “Engagement”
- Select “Pages and screens”
- Choose your analysis time frame
- Set the Primary Dimension to “Page Title”
- Click the “+” icon next to the primary dimension to add a secondary dimension
- Click “Custom”
- Select “page_location” (alternatively you can search for page_location)
- Click on the “Share this report” icon
- Select Download File > Download CSV Save As “ga_titles.csv”
#2. Export your Google Search Console Pages report:
- Go to Performance and click “Search results”
- Go to Date and click the “Customize report (pencil icon)”
- Change the date range to match your GA4 report and click “Apply”
- Click “Export” > Download CSV > Save As “gsc_pages.csv”
- Clean up your CSV file removing the report, account, property, etc, so your AI tool can properly analyze the data.
#3. Upload your GA and GSC reports to ChatGPT
#4. Enter Prompt #1:
“I’m giving you two files. One shows search traffic URLs. The other shows page titles and URLS.
Merge these into one file, so there is a single row for each URL using the most representative title for each.
Please provide a link to download.”
#5. Enter Prompt #2:
“You are an expert content strategist and SEO, looking for new topics to cover.
Infer topics from the titles of the articles in the spreadsheet.
Identify gaps in content using semantic distance analysis.
Suggest articles and topics that would fill those gaps.”
#6. Enter Prompt #3:
“Expand the topics into 50 subtopics, then proceed with the semantic distance analysis and gap identification.”
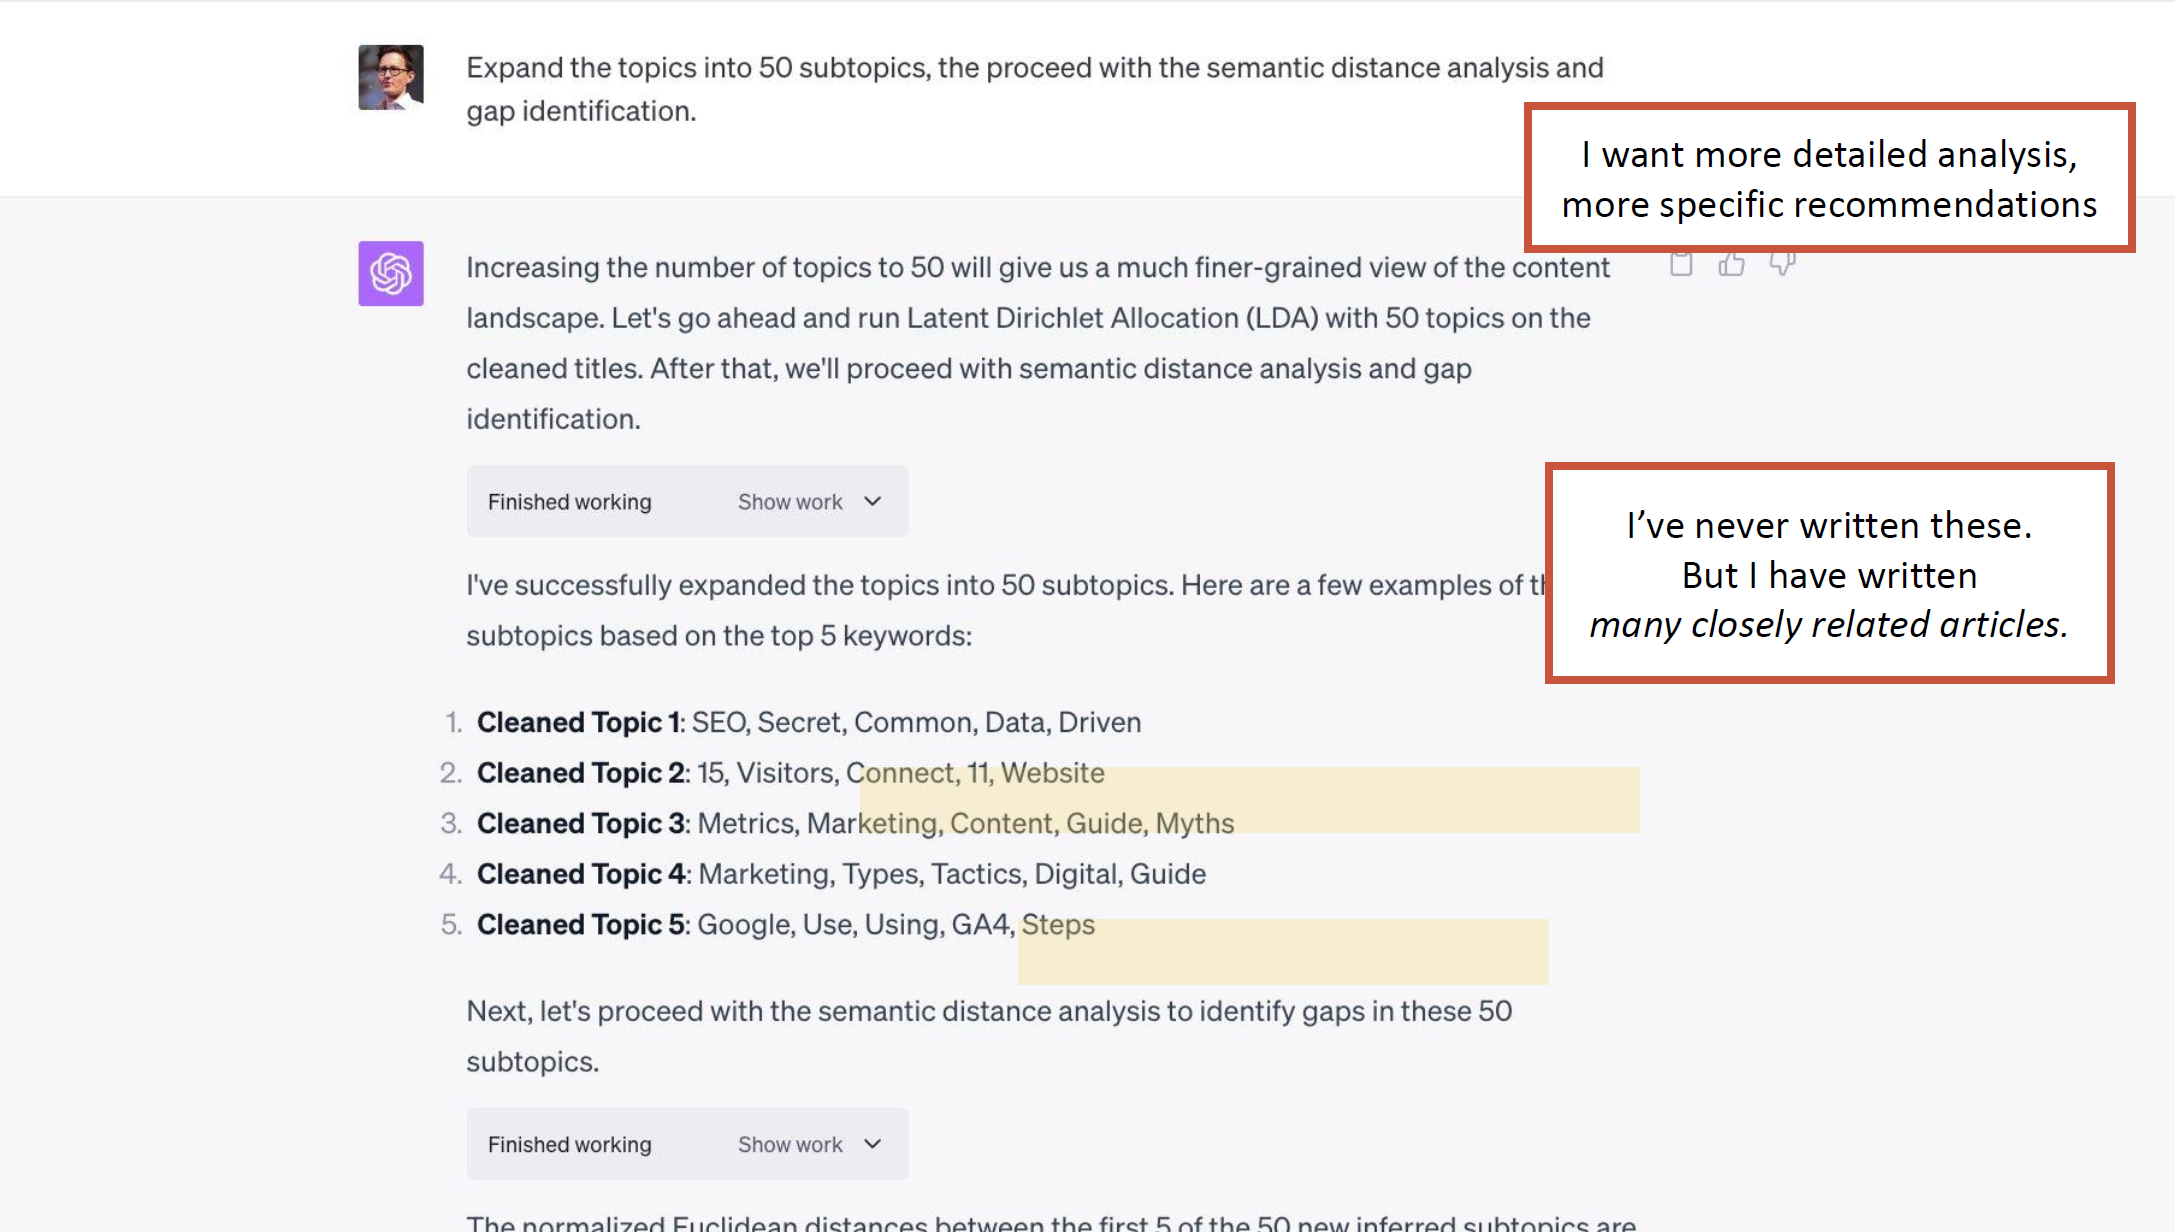
#6. Enter Prompt #4:
“Using a red x, show where this article would fit into the visualization:
“Analytics Gaps and How to Fill Them”
“We also have our own biases to the topics that [we] like. And the reason why you haven’t written about this topic isn’t something that leaps to mind. So this is like taking your brain outside of yourself essentially and saying, please point out the flaws [in] my own thinking around this topic.” Dana DiTomaso
“And that I think is one of the best uses for AI, if you’re an analyst, is gap analysis. That’s basically what I’m doing here is like AI powered gap analysis. Human brains are just not good for that. AI is great for that.” Andy Crestodina
Level up your GA4 reporting and data analysis skills
Social media engagement analysis
Let AI analyze your top performing social posts! This example features Creator Mode data from LinkedIn (if you don’t have this you won’t be able to do this), but you can apply it to any of your social platforms that you can extract data from.
How to analyze LinkedIn engagement using ChatGPT
#1. Export Analytics Data from LinkedIn (Creator Mode is required)
- Log in to your LinkedIn account and click the “Analytics & tools” arrow at the top of your profile.
- Under “Posts” select a big date range (Past 356 days)
- Click “Export”
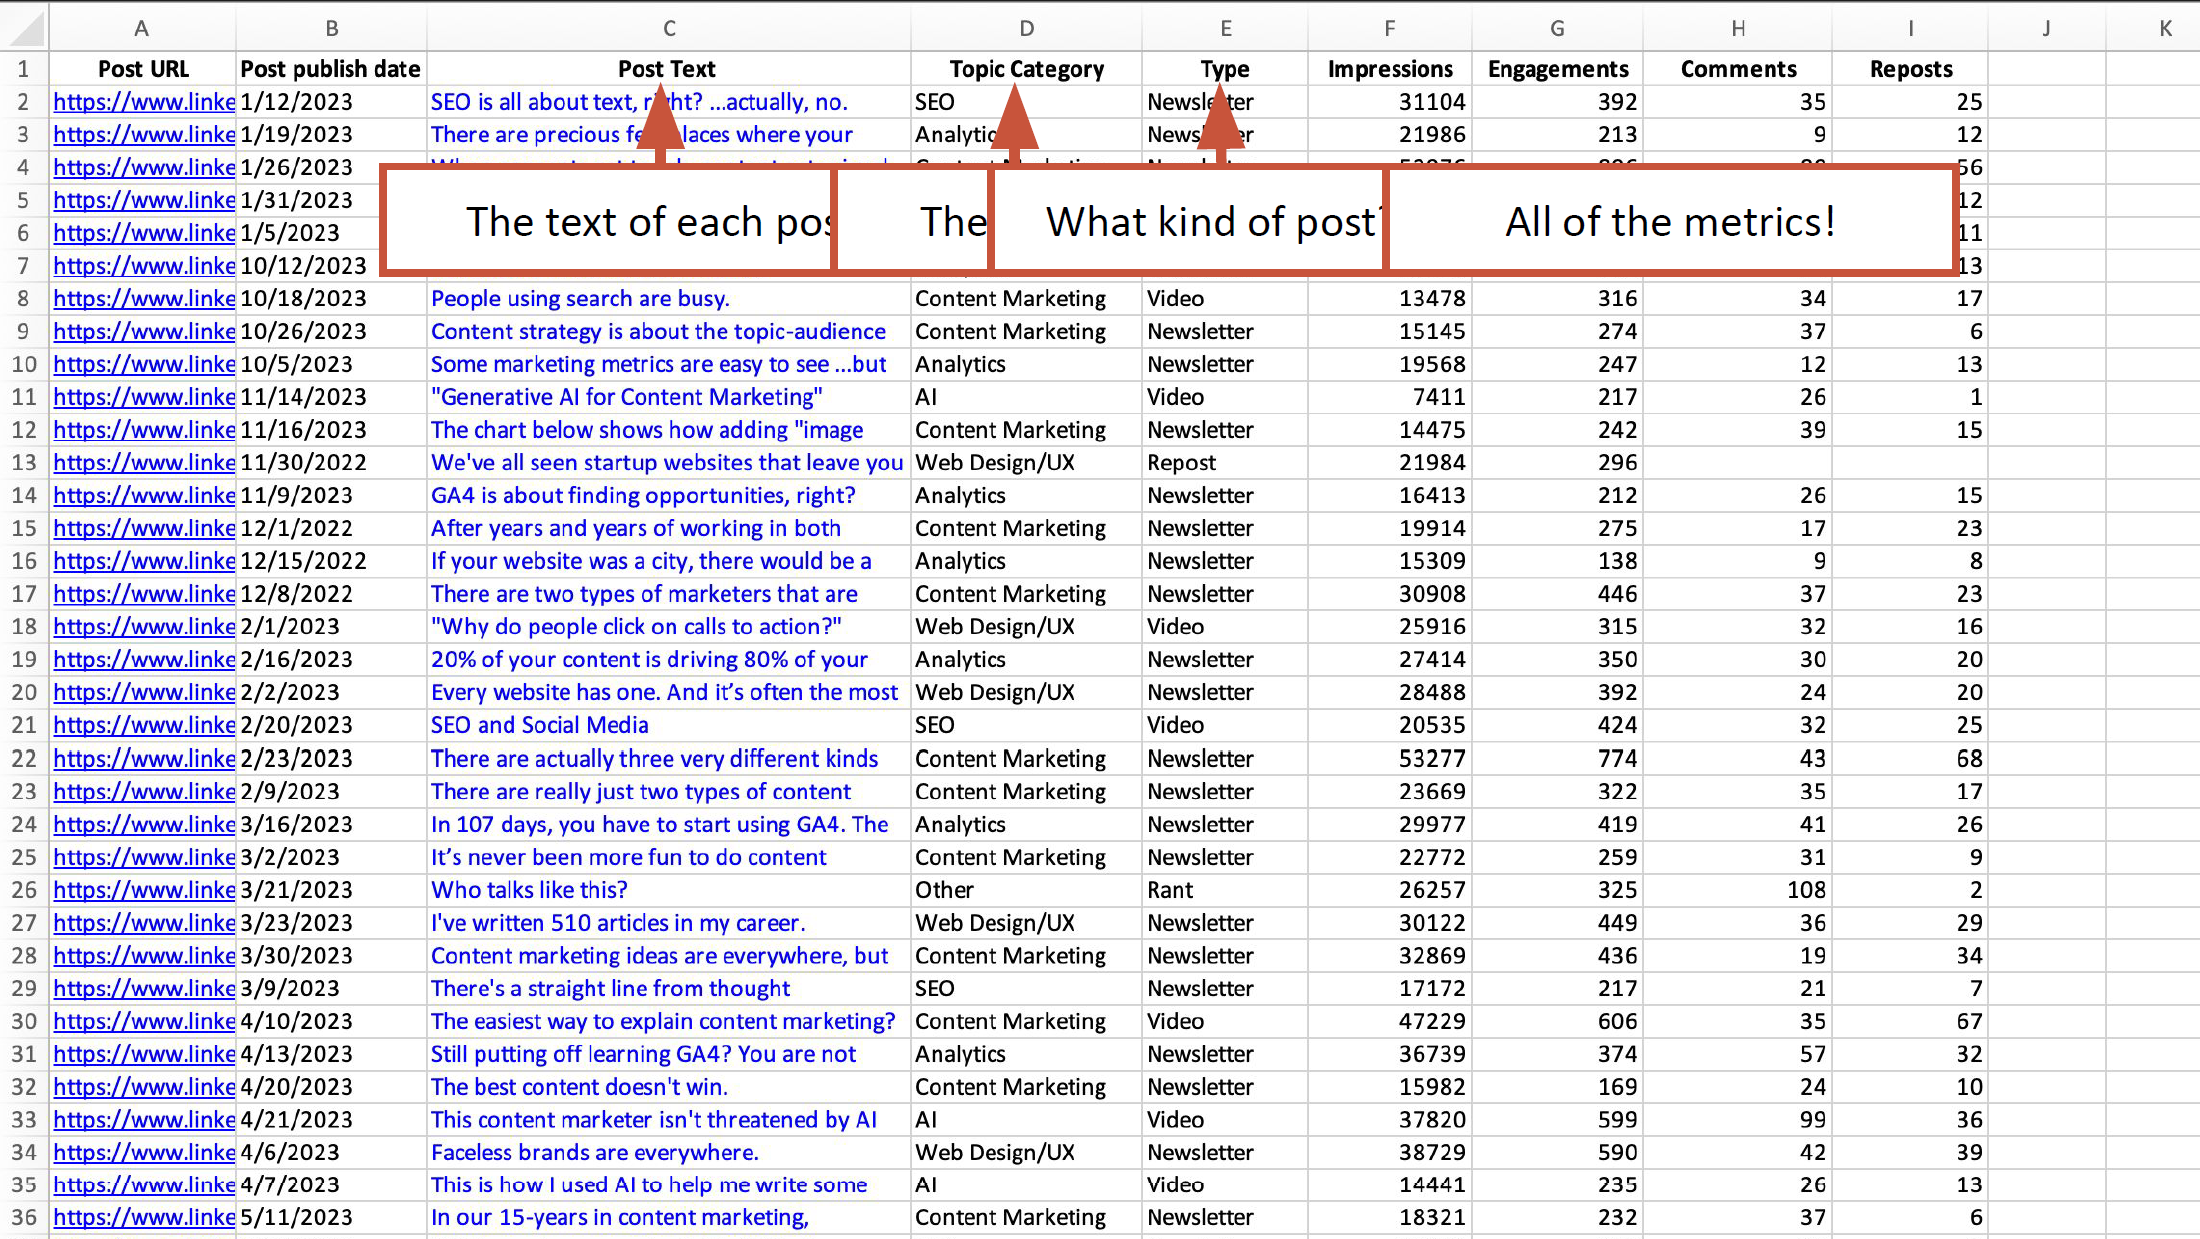
#2. Clean up the Exported Data
This step took Andy about two hours to complete because the spreadsheet was an unstructured mess and incomplete. It needed categories like:
- Post Text
- Topic Categories
- Post Type
“I’m not a marketer that teaches shortcuts. I’m obsessed with quality and I have very long, slow ways to do things, but it works. I strongly believe it’s the 10x effort that gets 100x results. I am not very interested in using AI for efficiency. That’s not my purpose. I’m using AI to produce content that is more comprehensive, more detailed, fills in a blank, plugs a hole, makes it surprisingly detailed to the reader, memorable.” Andy Crestodina
#3. Upload the cleaned up CSV file with your LinkedIn data to ChatGPT
#4. Enter Prompt #1:
“You are an expert social media marketing data analyst, skilled at finding insights from data about social media posts.
I’m giving you data showing the performance of top LinkedIn posts posted to a personal LinkedIn account over one year.
Which topics get the most follower growth per post, per engagement, per impression?”
#5. Enter Prompt #2:
“Draw a heatmap matrix showing the normalized average impressions, average engagement, average number of comments, average number of reposts and average number of new followers for each category.”
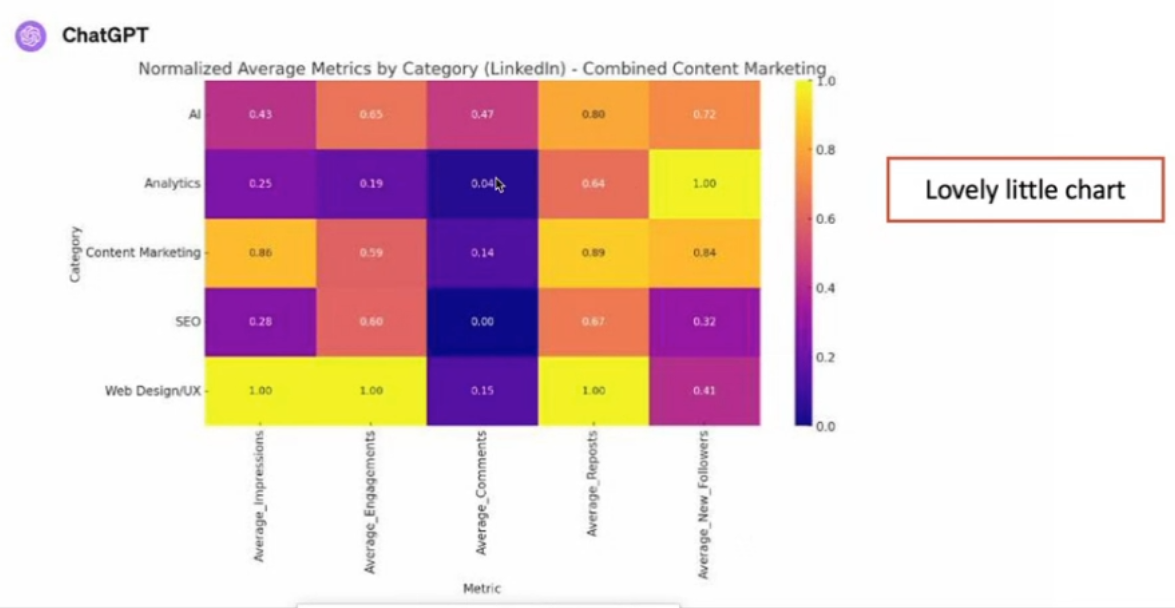
“It figured out the new followers based on the date. I love that it worked. And the data was surprising to me. This is the colored heatmap matrix showing me, based on topics that I talk about on LinkedIn, the average engagements for each. Surprise. The analytics topics grow followers fast, but those people don’t really engage. Web design UX people engage, but those people don’t really follow. I expected to see a correlation between engagement and follows. I did not.” Andy Crestodina
“I love this chart. My mind immediately goes to doing something like this in Looker Studio, but this actually looks better than something I can get out of Looker Studio. I always try to hammer home with reporting, especially if you’re reporting to like your boss or your clients to stop using tables, show visuals instead. This is a fantastic way to be like, I know you like posting about this topic, but your goal is followers and this isn’t getting you followers. We’re going to talk about this instead.” Dana DiTomaso
Train AI to use your methods and create a prompt library
💡 Andy recommends that if you achieved results from your prompts that are really cool, ask ChatGPT to create a prompt for you so that in the future you can replicated your methods — create a Shared Code Library.
For example: “Create a prompt that can work as a style guide that can be given to ChatGPT so the AI can effectively write future posts in this same voice, tone, and style.” This was a prompt related to writing LinkedIn posts.
If you prefer to create a Custom GPT you can definitely do so. For Andy, he finds that a Custom GPT is “basically appending all those instructions to the top of every prompt. And there isn’t really that big of a difference for me to go to the prompt [library and paste them in].”
Using AI anonymously
During the webinar many attendees had concerns about uploading client data, and the disclaimer at the beginning was that it’s important to know in advance what information you can and cannot use within your own organization.
“There are ways you can use AI anonymously though for people that are not willing to risk providing sensitive data to an OpenAI program.
There are ways to use AI, like there’s AI for healthcare data, AI for financial data. And big companies are setting up sequestered, kind of Azure server instances, which are not connected, you can unplug it from the internet.
- You can download LLMs from Hugging Face.
- You can run AI on your laptop.
- You can put a model, you can put llama Facebook’s Meta’s AI on your laptop and use LM Studio as the interface. Unplug it from the internet, right? You’ve gotta turn off Wi-Fi and you can use AI on your computer.
There are absolutely ways to use AI. It’s not ChatGPT, it’s not as good as GPT-4.” Andy Crestodina
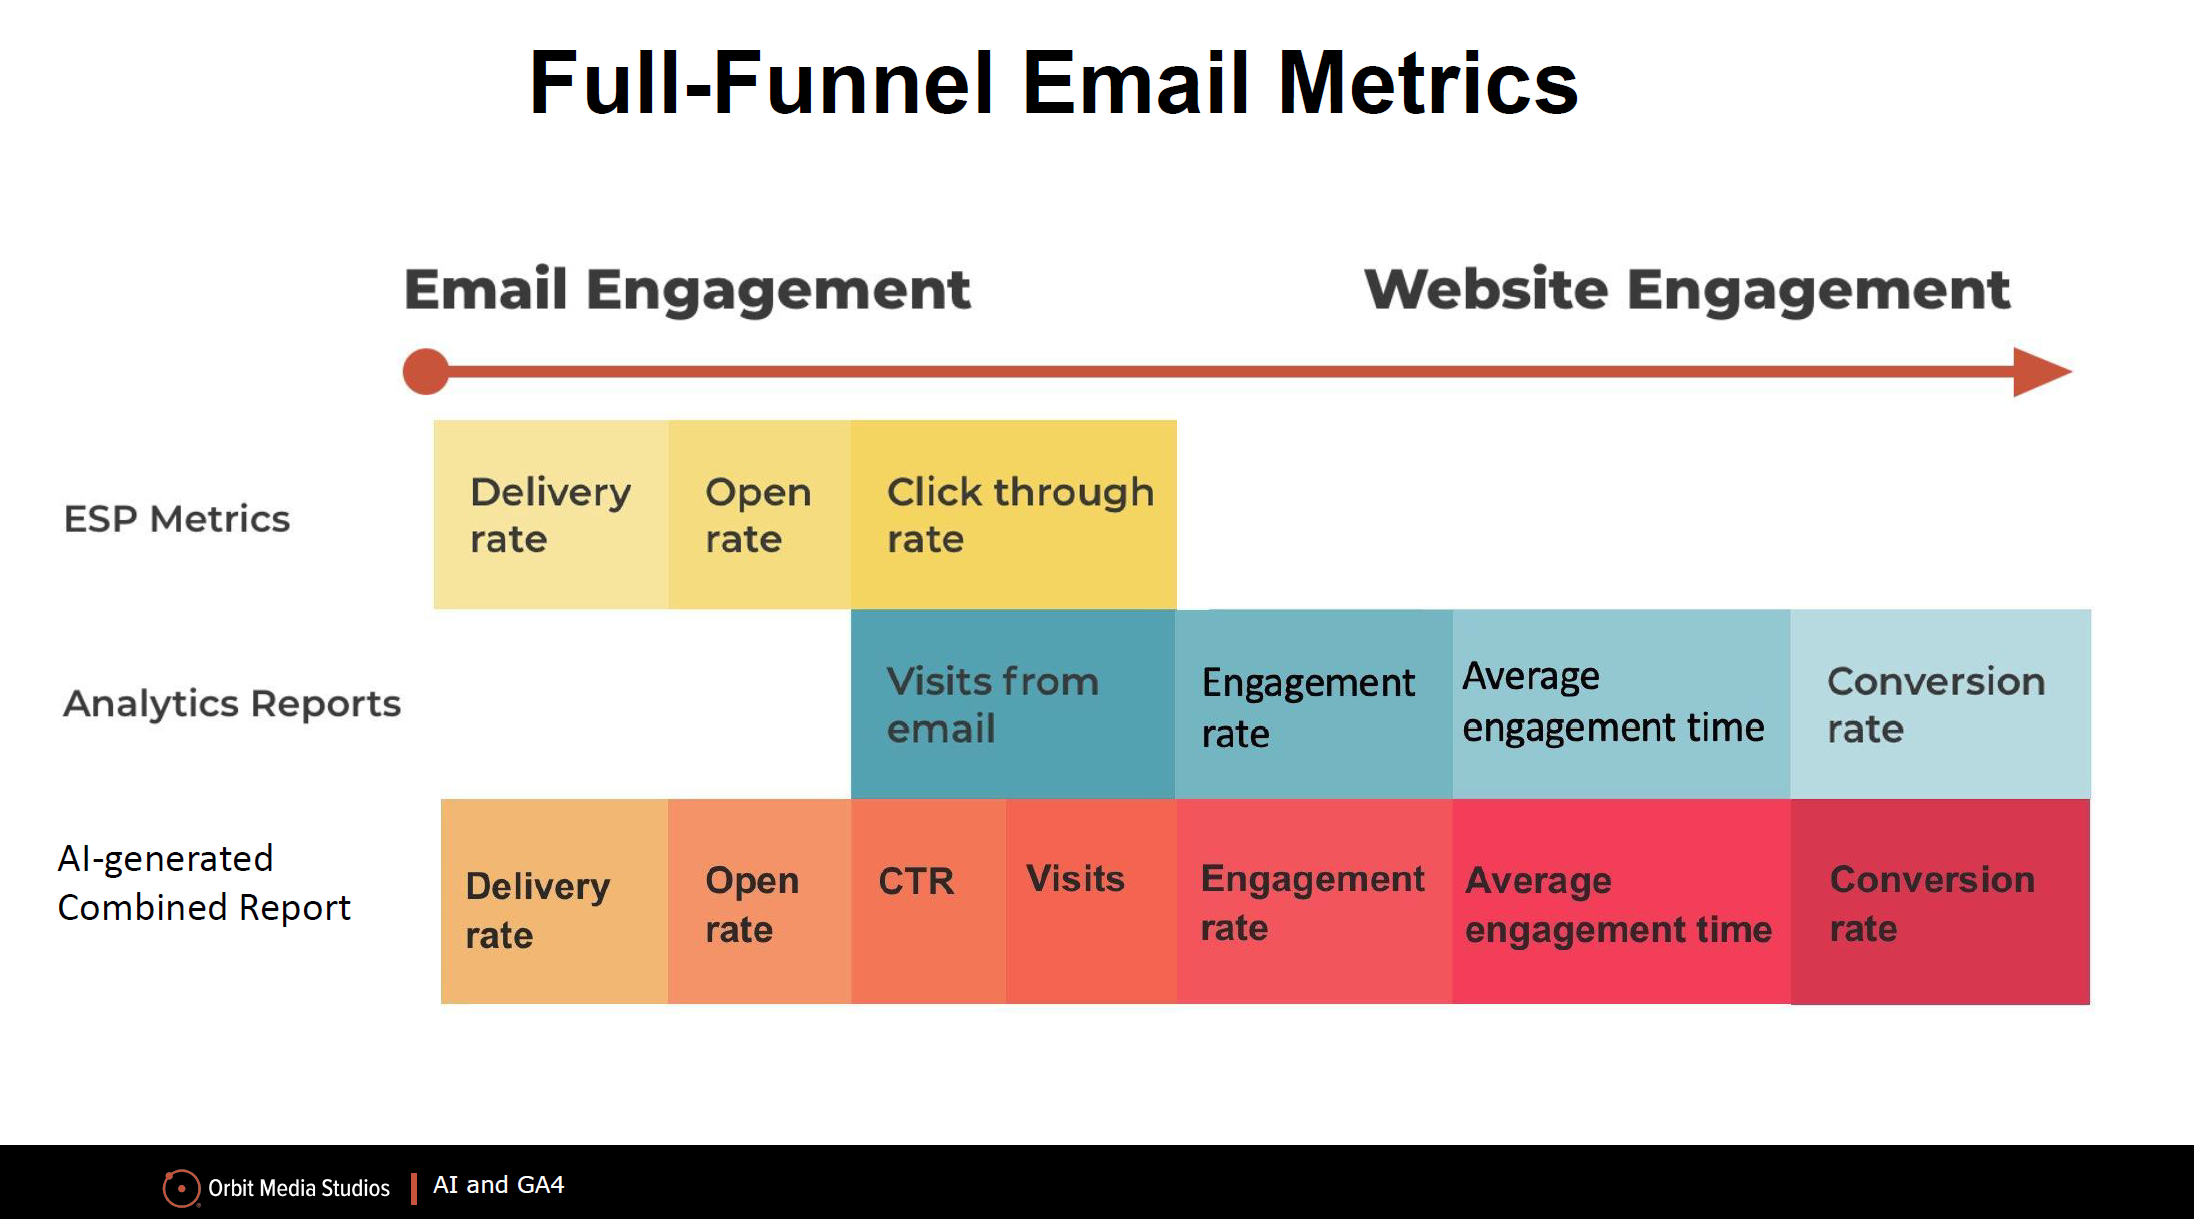
Using AI to combine email marketing data with GA4 data
By connecting data from your Email Service Provider (ESP) and your website metrics from GA4 you can get one united report that shows you the full-funnel email metrics from delivery of your emails to conversion.
How to draw insights from your email campaigns
#1. Pull data from your Email Service Provider (ESP)
Get the data from your email campaigns. Make sure that you have a wide date range.
#2. Export your email campaign traffic report from GA4
- Click on “Reports”
- Go to Life Cycle and click “Acquisition”
- Select “Traffic acquisition”
- Change the primary dimension to “Session campaign”
- Click “Add filter+”
- Where the Dimension is “Session default channel group”
- Match Type is “exactly matches”
- Value is “Email” (so you’re only pulling Email campaign data)
- Click “Apply”
#3. Upload your “ESP Data” campaign performance information
#4. Enter Prompt #1
“I’m giving you data from [ESP Name] about email performance.
Can you analyze”
#5. Upload “GA4 Data” CSV file from Google Analytics report
Make sure that you are using the same time period in both reports
#6. Enter Prompt #2
“I’m giving you data from Google Analytics about website traffic from email campaigns.
Can you analyze?”
#7. Enter Prompt #3
“These two datasets show the performance of the same campaigns both from the email service provider ([Enter Provider Name]) and the website behaviour (Google Analytics). I want to see the performance of each campaign across both data sets.
Merge the Google Analytics data with the [ESP Name] data, combining “session campaign” and “campaign name” into one column, inferring which campaigns were the same based on names and dates.
Provide link to download”
#8. Enter Prompt #4
“You are a skilled digital strategist and email marketing expert.
What insights can you gather from the combined dataset?”
#9. Try a Long Shot Prompt
“What can you tell me about these email campaigns? What types of insights can you gather from this data?
Make a chart using an unusual visualization method showing unexpected insights from the data in this dataset.
How would Leonardo DaVinci visualize this data? Show your thinking.”
#10. Enter Prompt #5
“Categorize the articles into marketing topics.
How do topics correlate with metrics?”
#11. Enter Prompt #6
“Draw a chart showing the performance of each topic across 7 key email marketing metrics”
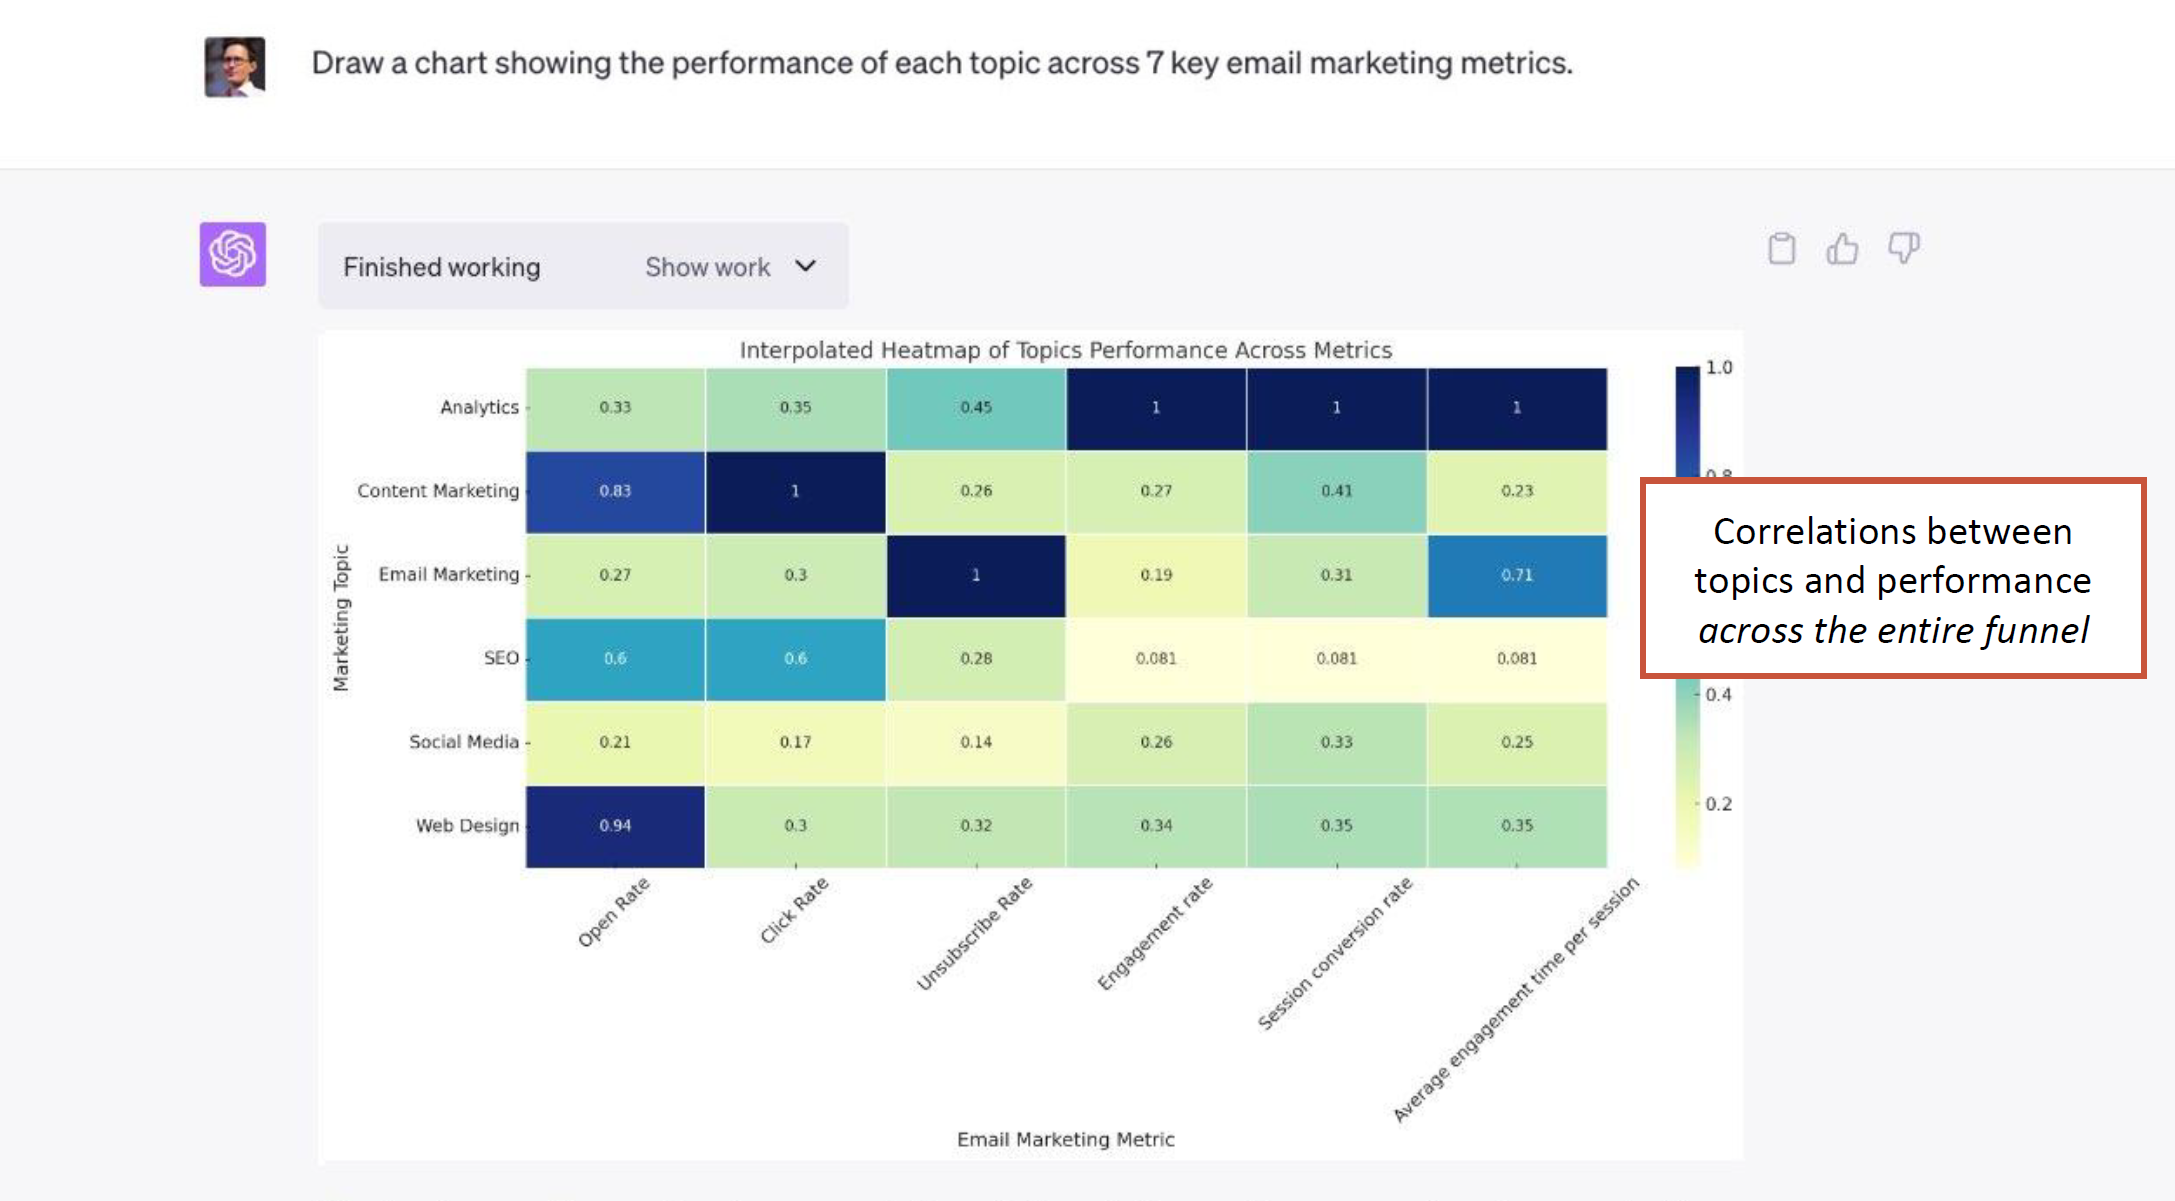
“Every topic I talk about in every email I send. Open rate, click through rate, unsubscribe rate, GA4 engagement rate, session conversion rate, average engagement time, in one chart. I don’t think most marketers have ever seen that. I’ve never seen that. That’s [would be] hard to build that chart, right?” Andy Crestodina
#12. Even More Strategy Prompts
“Based on this data, what types of campaigns should be sent more often? What types of campaigns should be abandoned?
You are an expert email marketing strategist. Suggest adjustments to this email marketing program based on the data provided.
Suggest changes that would improve the efficiency of this email program.
Based on this data, what 5 email subject lines would lead to sales?”
#13. Enter Prompt #7
“What open rate, click rate, users, engagement rate and conversion rate would you expect from the following subject line?
[Enter your subject line]”
Campaign timing analysis
Get AI to correlate dates, days, and seasonality for you
How to see if your email campaigns are impacted by dates, days, or seasons
#1. Export your email campaign Traffic report (with dates) from GA4
- Click on “Reports”
- Go to Life Cycle and click “Acquisition”
- Select “Traffic acquisition”
- Change the primary dimension to “Session campaign”
- Click “Add filter+”
- Where the Dimension is “Session default channel group”
- Match Type is “exactly matches”
- Value is “Email” (so you’re only pulling Email campaign data)
- Add a secondary dimension of “Date”
- Click “Apply”
#2. Upload your GA4 data to ChatGPT
#3. Enter Prompt #1
“I’m giving you newsletter campaign data with dates. Can you analyze?”
#4. Enter Prompt #2
“Draw two charts:
One showing correlations by month.
One showing correlations by day-of-week.
Normalize the data”
#5. Enter Prompt #3
“Create and display a one-year calendar for this newsletter.
Schedule it bi-weekly, selecting dates for optimal performance.
Write draft headlines for each, selecting topics for optimal performance.”
Conversion rates of specific articles
Learn which articles on your site are inspiring visitors to subscribe!
How to determine conversion rates of articles
Note: For this version Andy shares the article as the page referrer and the thank you page represents the conversion for subscribing to the newsletter.
#1. Export Traffic data from GA4
- Go to “Reports” > Life Cycle > click “Engagement”
- Select “Pages and screens”
- Choose your analysis time frame
- Set the Primary Dimension to “Page path and screen class”
- Now customize your metrics (click on the pencil icon)
- Sessions
- Users
- Conversions
- Create a filter to show only blog posts
- Dimension = “Page_Location”
- Match Type = “contains”
- Value = “blog”
- Export the CSV and save as Traffic.csv
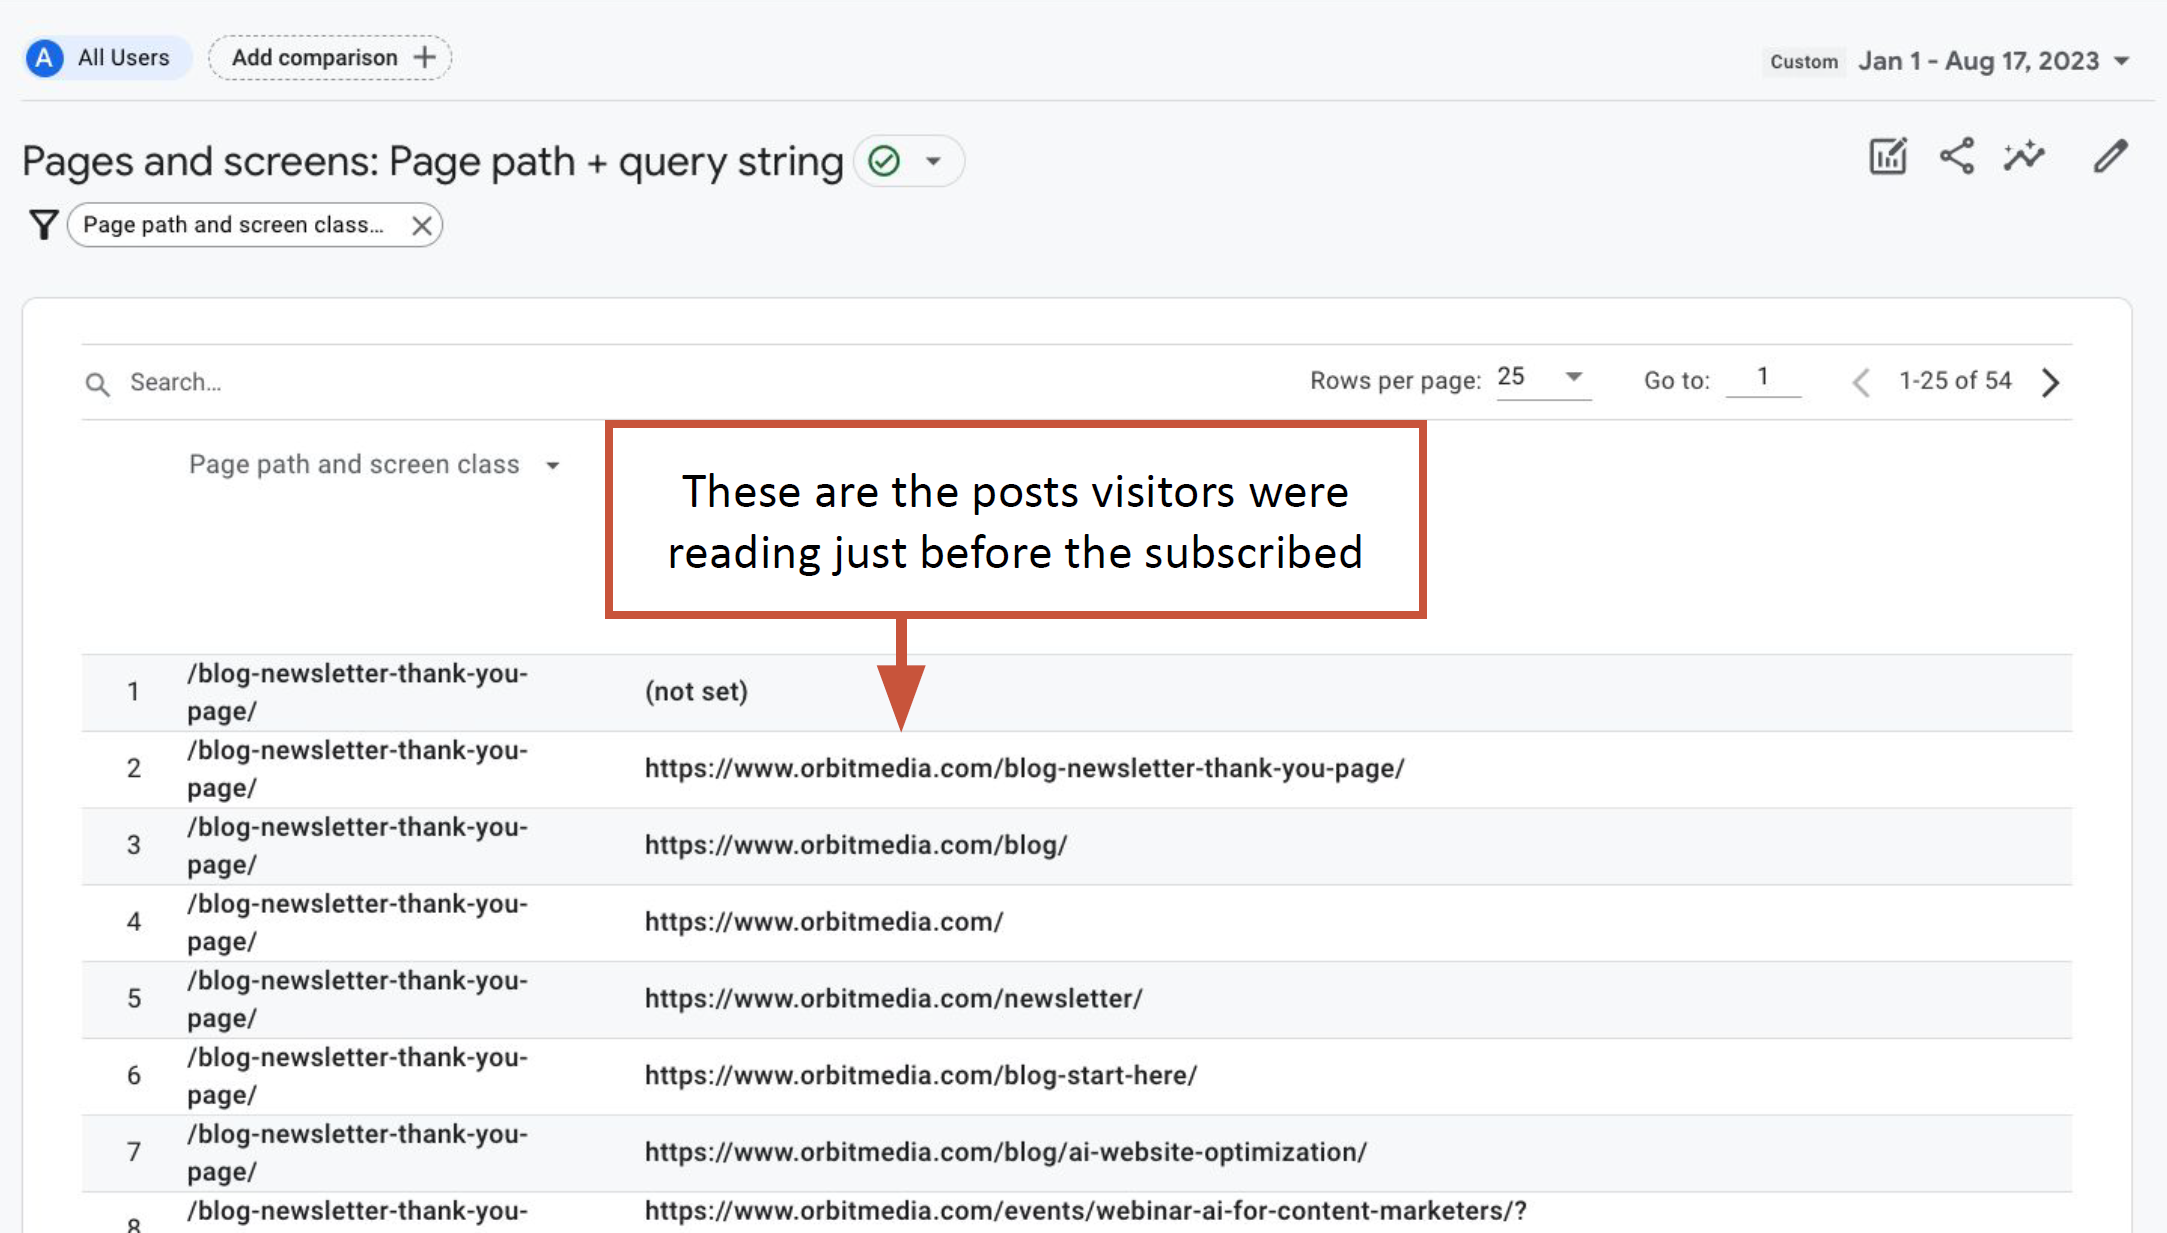
#2. Export thank you page data from GA4
- Go to “Reports” > Life Cycle > click “Engagement”
- Select “Pages and screens”
- Choose the same analysis time frame as above
- Add a filter to your report to show your email signup thank you page (in Andy’s example he uses a /blog-newsletter-thank-you-page)
- Add a Second Dimension of “Page Referrer”
- Export the CSV and save as Conversions.csv
Does your site not have an easy way to filter blog posts? Learn how to track conversion rates another way!
#3. Upload Your GA4 Traffic Data
#4. Enter Prompt #1
“I’m giving you Google Analytics data showing traffic to blog posts. Can you analyze?”
#5. Upload Your GA4 Conversion Data
#6. Enter Prompt #2
“I’m giving you data about conversions (visitors subscribing to a newsletter) from that same blog. Confirm that you can access this data.
#7. Enter Prompt #3
“Merge the data from the two files together into one file, as you would do with a vlookup, so each row is a URL and the sessions and conversions are shown for each.”
#8. Enter Prompt #4
“Give me a link to download the new file”
#9. Data Cleanup Prompts
- Merge URLs that appear to be duplicates
- Filter out any anomalies
- Remove rows with URLs that do not contact the word “blog”
#10. Enter Prompt #5
“Draw a bar chart showing the conversion rate for each blog post”
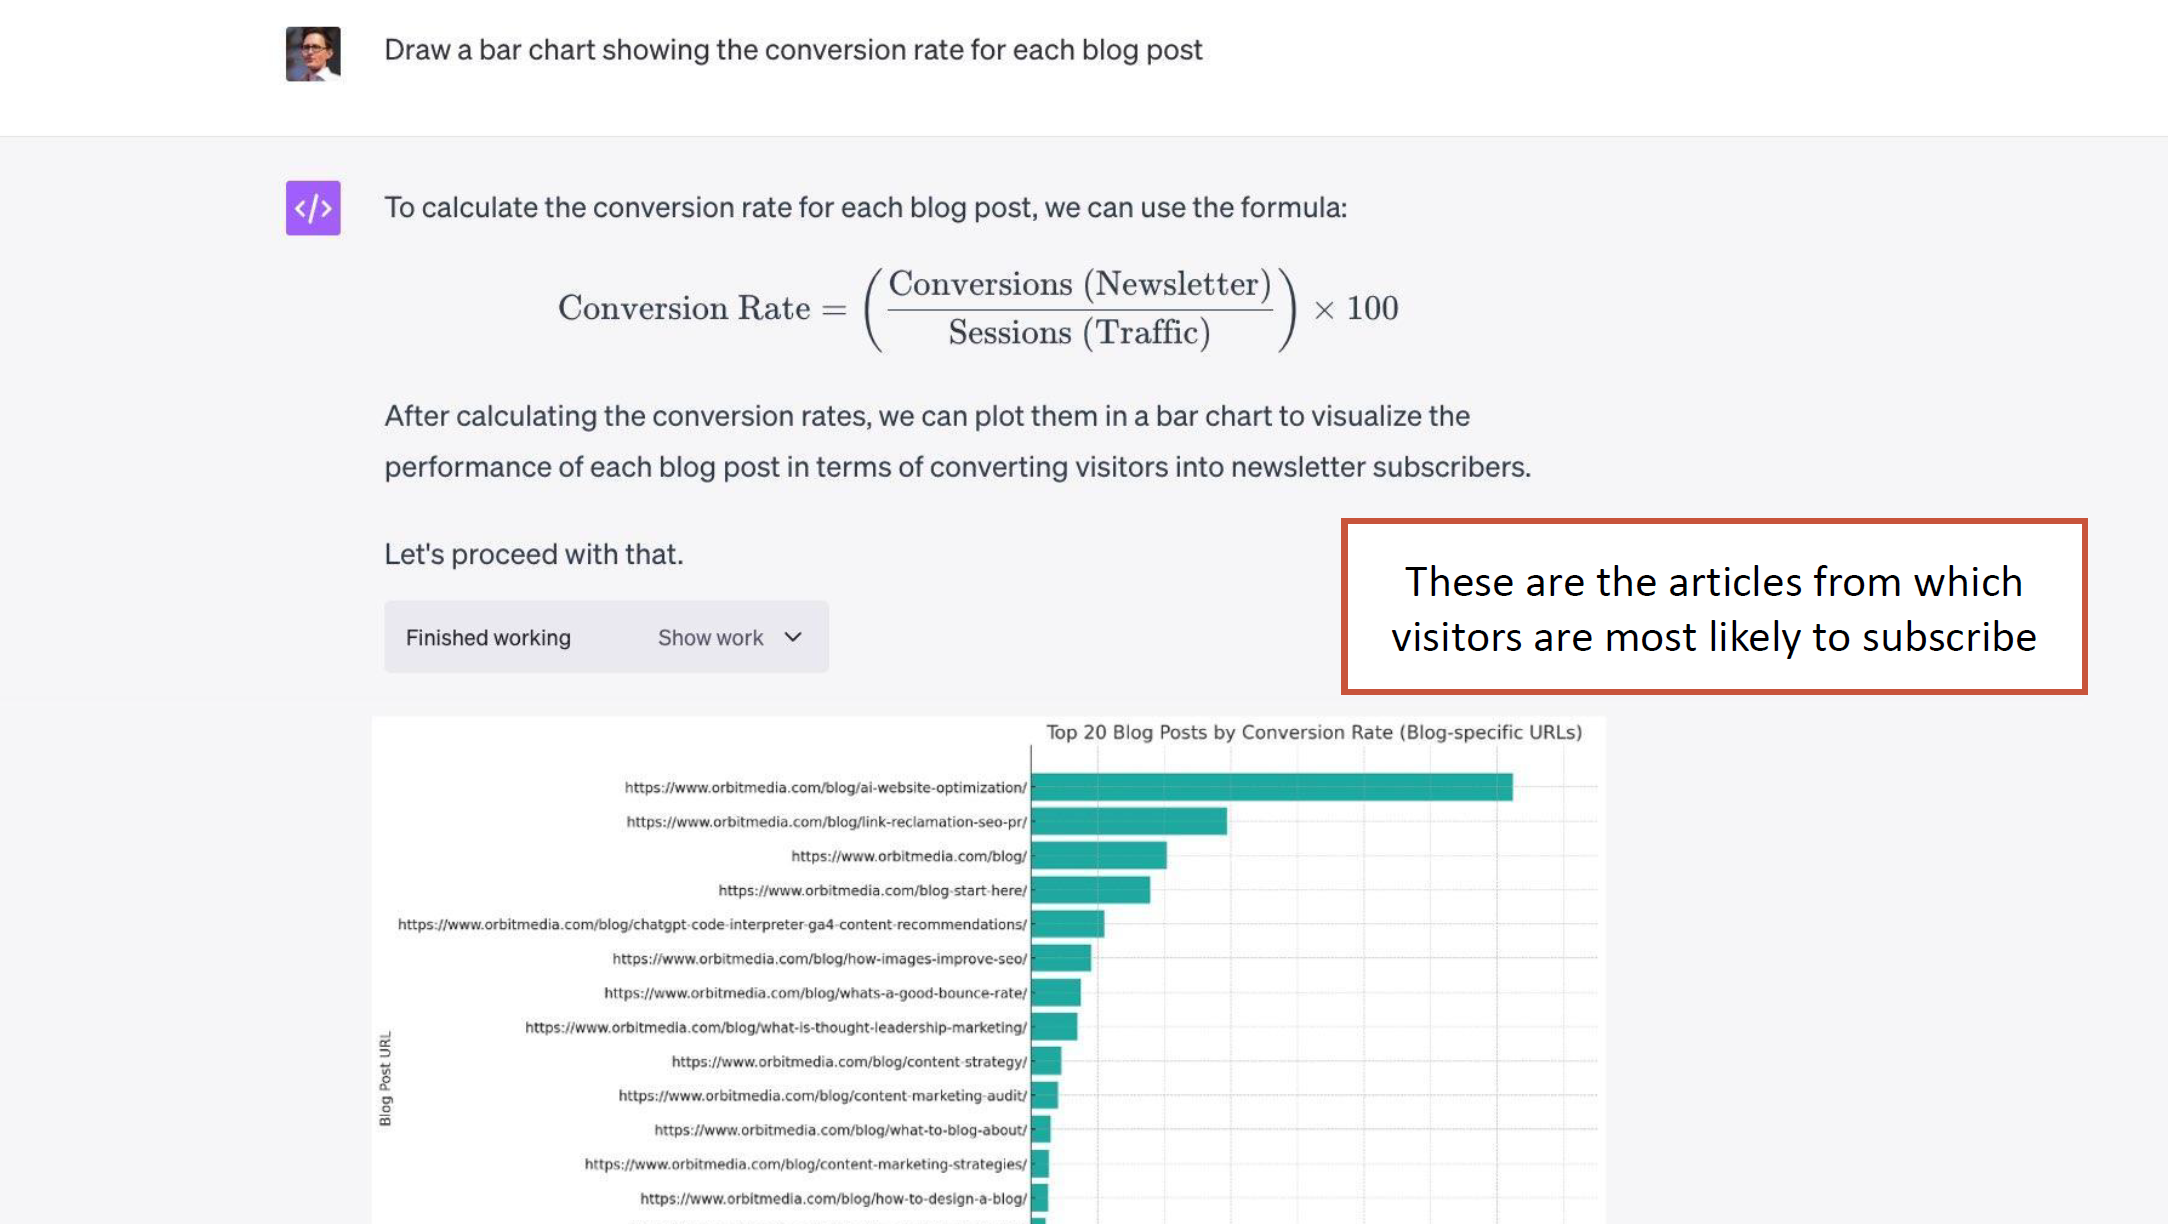
“It calculated correctly. That is the conversion rate from visitor to subscriber for every blog post on my blog. Now you know exactly which articles to put in heavy social rotation, which articles to put featured on your homepage, which articles to link to from your high traffic articles, which articles to send again as a newsletter, which articles to reference from a guest post, from a guest post on someone else, the articles to talk about in a podcast, they go on the show notes, anything, anywhere, all of them.” Andy Crestodina
💡 Take this even further: Dana DiTomaso recommends, “In Gravity Forms, for example, you can create a hidden form where the refer would actually be pushed into that field or pushed into the field on the form when people submit it. And then when that goes off to a campaign or whatever you end up using, you can include the page that people were on. Then you could pull the data from your ESP and say to Chat GPT, here’s a list of the pages in terms of conversion rate. Now pull a list of subscribers based on the pages they signed up on, which of these pages are driving the most engaged subscribers as well.”
Getting the Idea?!
Are you feeling inspired about all of the potential AI methods and the different analyses you can test out ? Andy recommends that anytime you see an export button, get that data and start experimenting.
Now go forth and collaborate with your favourite AI tool and let us know on Twitter or LinkedIn how these methods have helped!

Jessie Low is the Marketing Manager and Course Consultant at Analytics Playbook. She has over 13 years of experience in the digital marketing industry. She loves working with businesses to develop SEO and content strategies that help grow their online visibility. From running a digital conference to product and service development, she’s dabbled in it all.
Learn more about Jessie

